Fig. 2.
Download original image
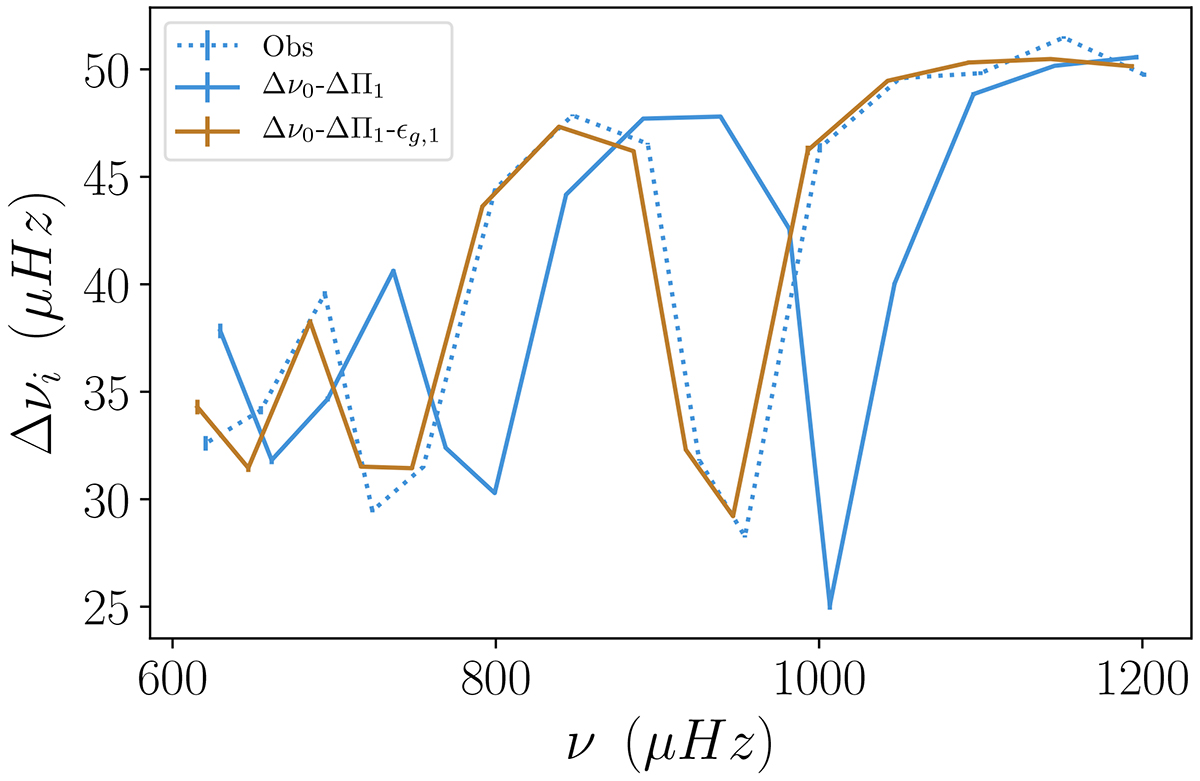
Comparison between observed pairwise frequency separations of dipolar modes and the modelled ones. The dotted blue line corresponds to the observation, the continuous blue line used only Δν0 and ΔΠ1 as fitting constraints, and the light brown one also includes the gravity offset ϵg, 1. All models are computed with an initial composition of X0 = 0.70 and Z0 = 0.017.
Current usage metrics show cumulative count of Article Views (full-text article views including HTML views, PDF and ePub downloads, according to the available data) and Abstracts Views on Vision4Press platform.
Data correspond to usage on the plateform after 2015. The current usage metrics is available 48-96 hours after online publication and is updated daily on week days.
Initial download of the metrics may take a while.