Fig. 18.
Download original image
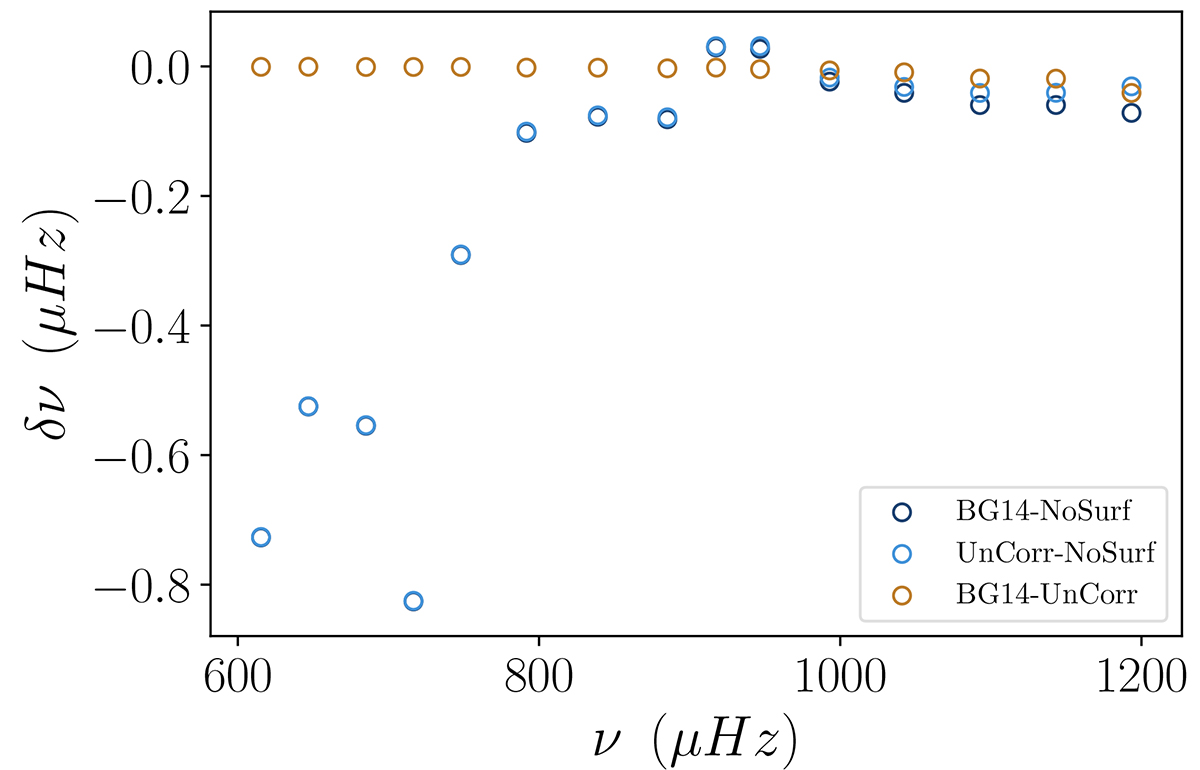
Frequency differences as a function of frequency. The difference between the frequencies of the optimal model including a correction of the surface effects following Ball & Gizon (2014) (BG14 in Table 3) and that of the model without a correction for the surface effects (X0 = 0.70, Z0 = 0.017, and αov = 0 in Table 3) is shown in dark blue. The difference between the same two models (BG14 and X0 = 0.70, Z0 = 0.017, and αov = 0) but using the frequencies of the corrected optimal model prior correction is shown in light blue. The light brown markers correspond to the magnitude of the surface correction term.
Current usage metrics show cumulative count of Article Views (full-text article views including HTML views, PDF and ePub downloads, according to the available data) and Abstracts Views on Vision4Press platform.
Data correspond to usage on the plateform after 2015. The current usage metrics is available 48-96 hours after online publication and is updated daily on week days.
Initial download of the metrics may take a while.