Open Access
Fig. 17.
Download original image
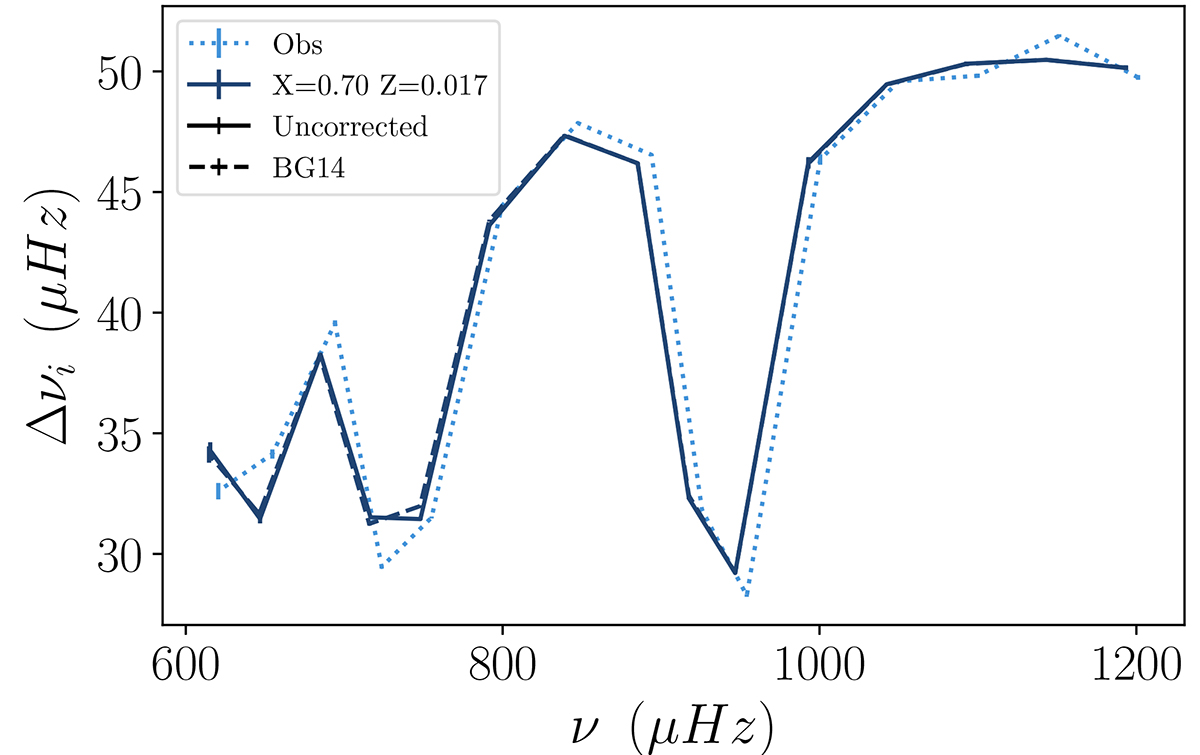
Pair-wise frequency separations for models with either uncorrected frequencies (black continuous line) or corrected frequencies according to Ball & Gizon (2014) (black dotted line) compared with the observed separations (blue dotted line).
Current usage metrics show cumulative count of Article Views (full-text article views including HTML views, PDF and ePub downloads, according to the available data) and Abstracts Views on Vision4Press platform.
Data correspond to usage on the plateform after 2015. The current usage metrics is available 48-96 hours after online publication and is updated daily on week days.
Initial download of the metrics may take a while.