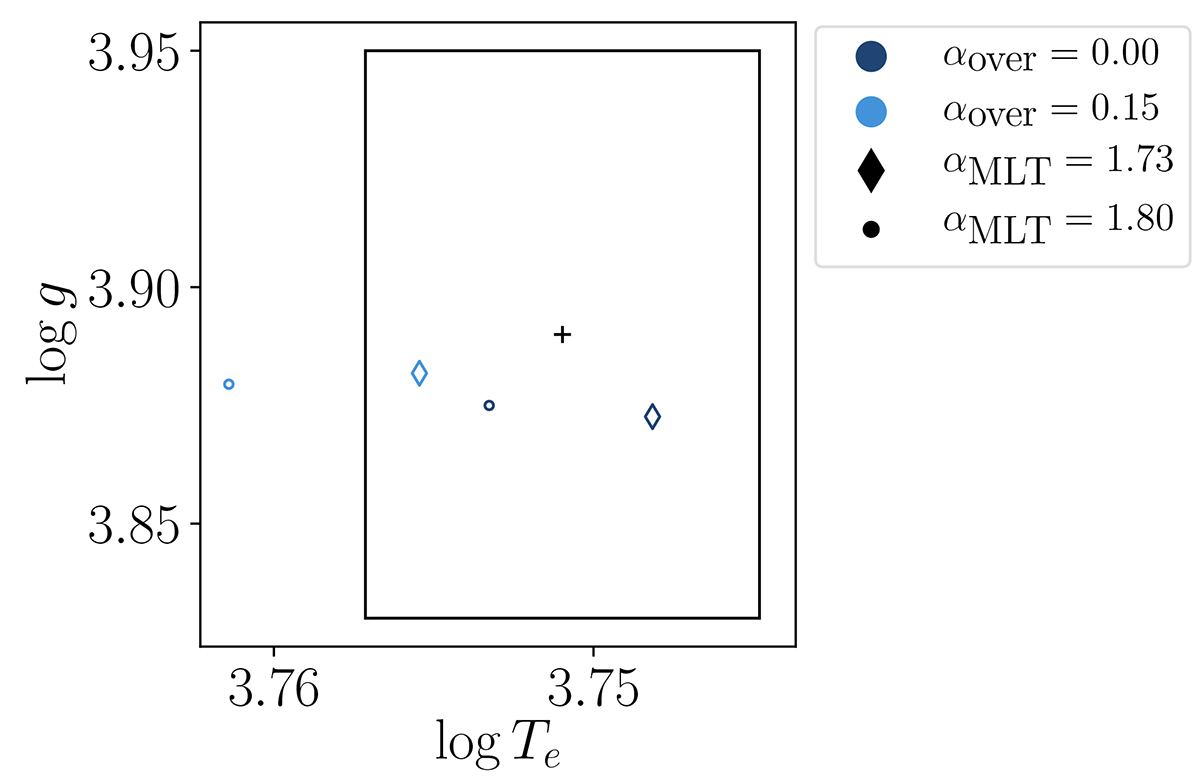
Fig. 12.
Download original image
Kiel diagram of the optimal models compared with the observed values, black box. Colour variations correspond to variations in initial hydrogen mass fraction and symbols to variations in initial metals fraction. Filled symbols are for models without overshooting while the empty ones have an overshooting parameter of αov = 0.15.
Current usage metrics show cumulative count of Article Views (full-text article views including HTML views, PDF and ePub downloads, according to the available data) and Abstracts Views on Vision4Press platform.
Data correspond to usage on the plateform after 2015. The current usage metrics is available 48-96 hours after online publication and is updated daily on week days.
Initial download of the metrics may take a while.