Fig. 1.
Download original image
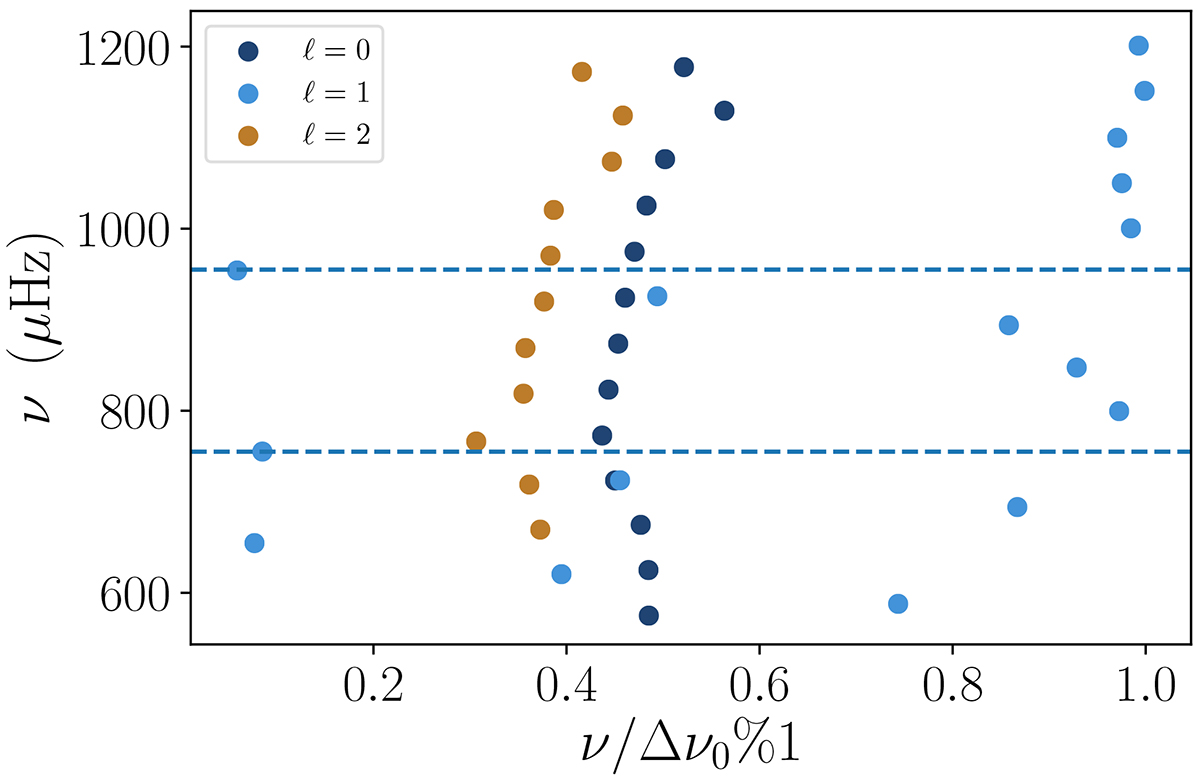
KIC11026764’s échelle diagram from the frequencies measured by Li et al. (2020b). The large frequency separation of radial modes determined by WhoSGlAd is used. Dark blue symbols correspond to radial modes, the light blue ones to dipolar modes and, the brown ones to quadrupolar modes. The horizontal dashed lines highlight the position of the detected g-dominated dipolar mixed modes.
Current usage metrics show cumulative count of Article Views (full-text article views including HTML views, PDF and ePub downloads, according to the available data) and Abstracts Views on Vision4Press platform.
Data correspond to usage on the plateform after 2015. The current usage metrics is available 48-96 hours after online publication and is updated daily on week days.
Initial download of the metrics may take a while.