Fig. C.1.

Download original image
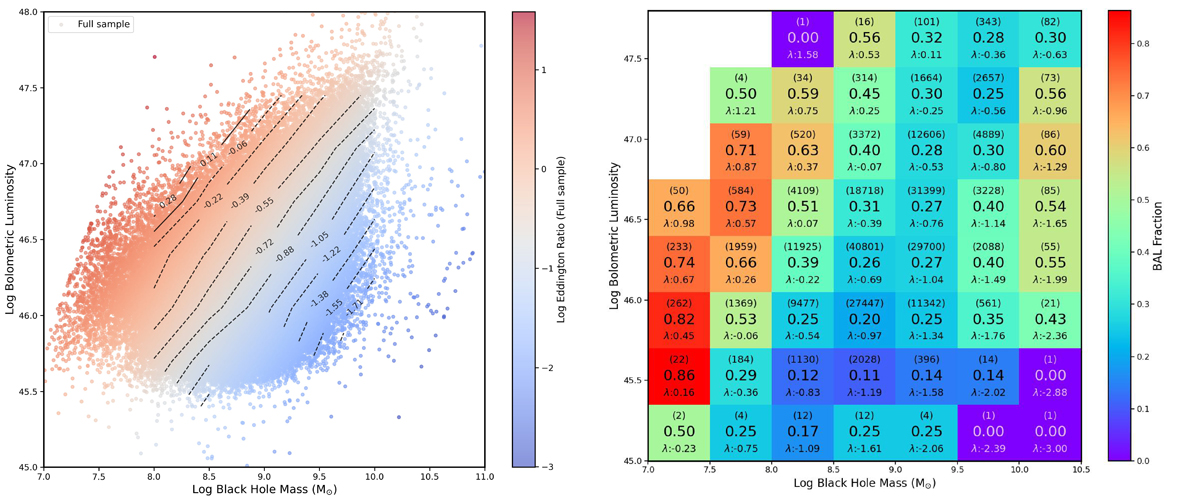
Left panel: Scatter plot of black hole mass (log MBH) vs. bolometric luminosity (log Lbol) for the Full quasar sample in this study. Data points are color-coded by their log Eddington ratio (λ). The black contours indicate the Eddington ratio distribution of the main sample, with the Eddington ratio values marked at each contour level. Right panel: Binned grid of log MBH and log Lbol, showing the BAL fraction in each bin (marked at the center and color-coded). The total number of quasars and the median Eddington ratio in each bin are displayed at the top and bottom of each bin, respectively.
Current usage metrics show cumulative count of Article Views (full-text article views including HTML views, PDF and ePub downloads, according to the available data) and Abstracts Views on Vision4Press platform.
Data correspond to usage on the plateform after 2015. The current usage metrics is available 48-96 hours after online publication and is updated daily on week days.
Initial download of the metrics may take a while.


