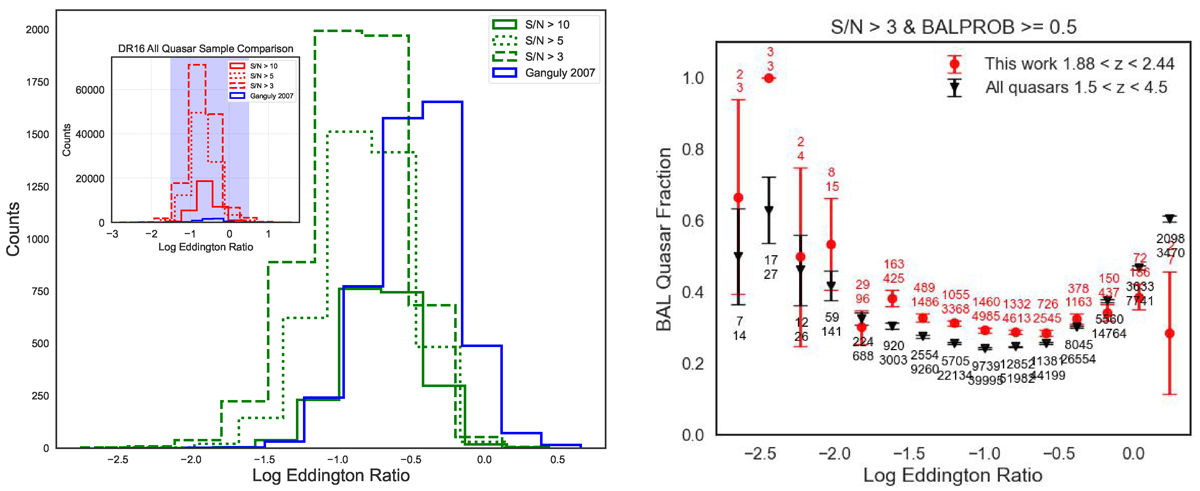
Fig. B.1.
Download original image
Left panel: Distribution of Eddington ratios for the two quasar samples in this study, as compared to Ganguly et al. (2007). The green curves represent quasars within 1.88 < z < 2.44 with reliable Mg II-based Eddington ratios across three S/N thresholds, while the Ganguly et al. (2007) sample appears in blue. The inset shows a broader quasar sample with 1.5 < z < 4.5 and all available Eddington ratios, with the shaded region indicating the Ganguly et al. (2007) Eddington ratio distribution. Right panel: BAL fraction as a function of Log Eddington ratio for the S/N > 3 threshold sample with just ZWARNING == 0 selection filter.
Current usage metrics show cumulative count of Article Views (full-text article views including HTML views, PDF and ePub downloads, according to the available data) and Abstracts Views on Vision4Press platform.
Data correspond to usage on the plateform after 2015. The current usage metrics is available 48-96 hours after online publication and is updated daily on week days.
Initial download of the metrics may take a while.