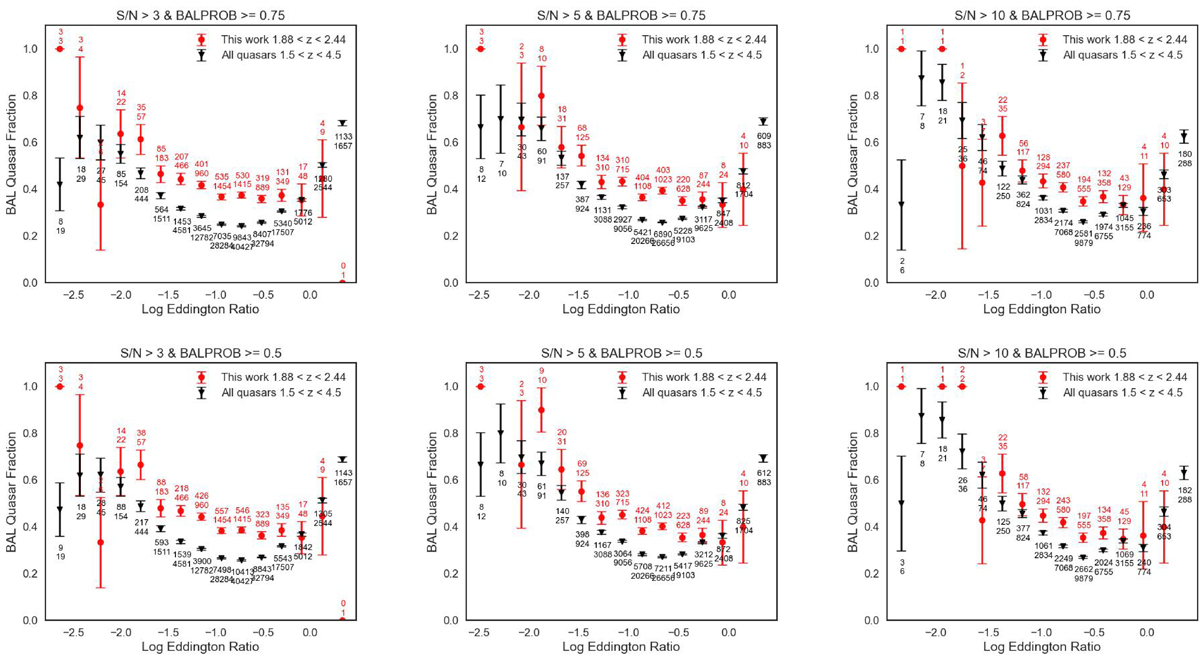
Fig. A.1.
Download original image
The figure shows the BAL fraction across two quasar samples analyzed in this study: (1) quasars with redshifts between (1.88 < z < 2.44) with reliable Eddington ratio estimates based solely on Mg II black hole mass measurements, and (2) quasa, with all available Eddington ratio measurements. The panels are arranged in rows and columns to showcase the effects of different signal-to-noise ratio (S/N) cuts and BAL definitions. Each column represents a distinct S/N threshold (top: S/N > 3, middle: S/N > 5, bottom: S/N > 10), while each row corresponds to a different BAL definition from the DR16 quasar catalog. The definitions vary by BAL probability: BAL_PROB ≥ 0.75 (includes cases with significant Absorption Index measurements), and BAL_PROB ≥ 0.5 (includes all BAL quasars including the ones with less significant Absorption Index measurements).
Current usage metrics show cumulative count of Article Views (full-text article views including HTML views, PDF and ePub downloads, according to the available data) and Abstracts Views on Vision4Press platform.
Data correspond to usage on the plateform after 2015. The current usage metrics is available 48-96 hours after online publication and is updated daily on week days.
Initial download of the metrics may take a while.