Fig. 2.
Download original image
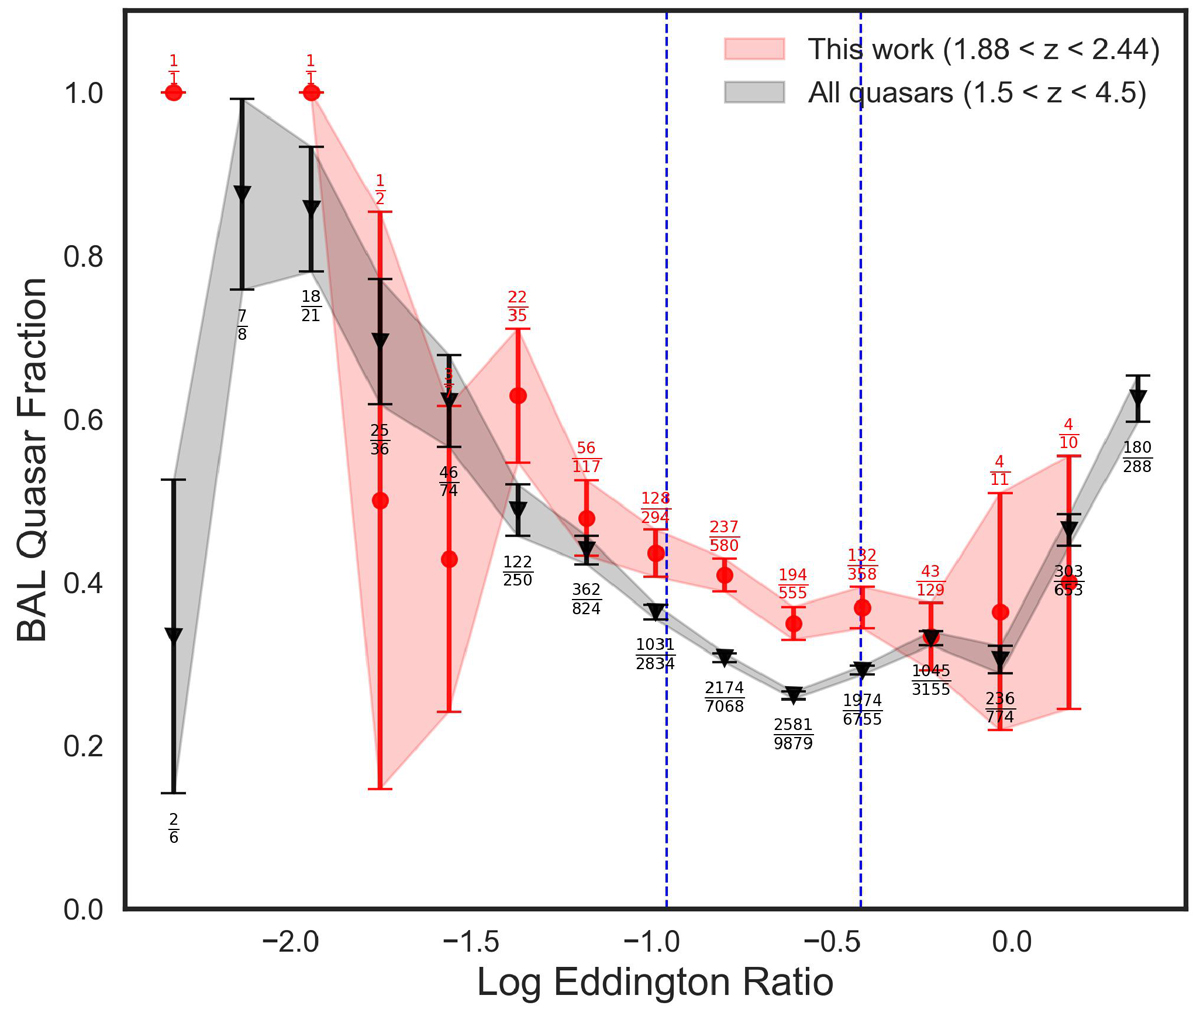
BAL quasar fraction as a function of Log Eddington ratio. The error bars and shaded regions represent binomial errors. The red circles correspond to the 1.88 < z < 2.44 sample with Mg II-based black hole masses, while the black triangles represent the broader 1.5 < z < 4.5 sample. The blue dashed lines mark one standard deviation from the mean Log Eddington ratio, defining the low and high Eddington ratio regions.
Current usage metrics show cumulative count of Article Views (full-text article views including HTML views, PDF and ePub downloads, according to the available data) and Abstracts Views on Vision4Press platform.
Data correspond to usage on the plateform after 2015. The current usage metrics is available 48-96 hours after online publication and is updated daily on week days.
Initial download of the metrics may take a while.