Fig. 1.
Download original image
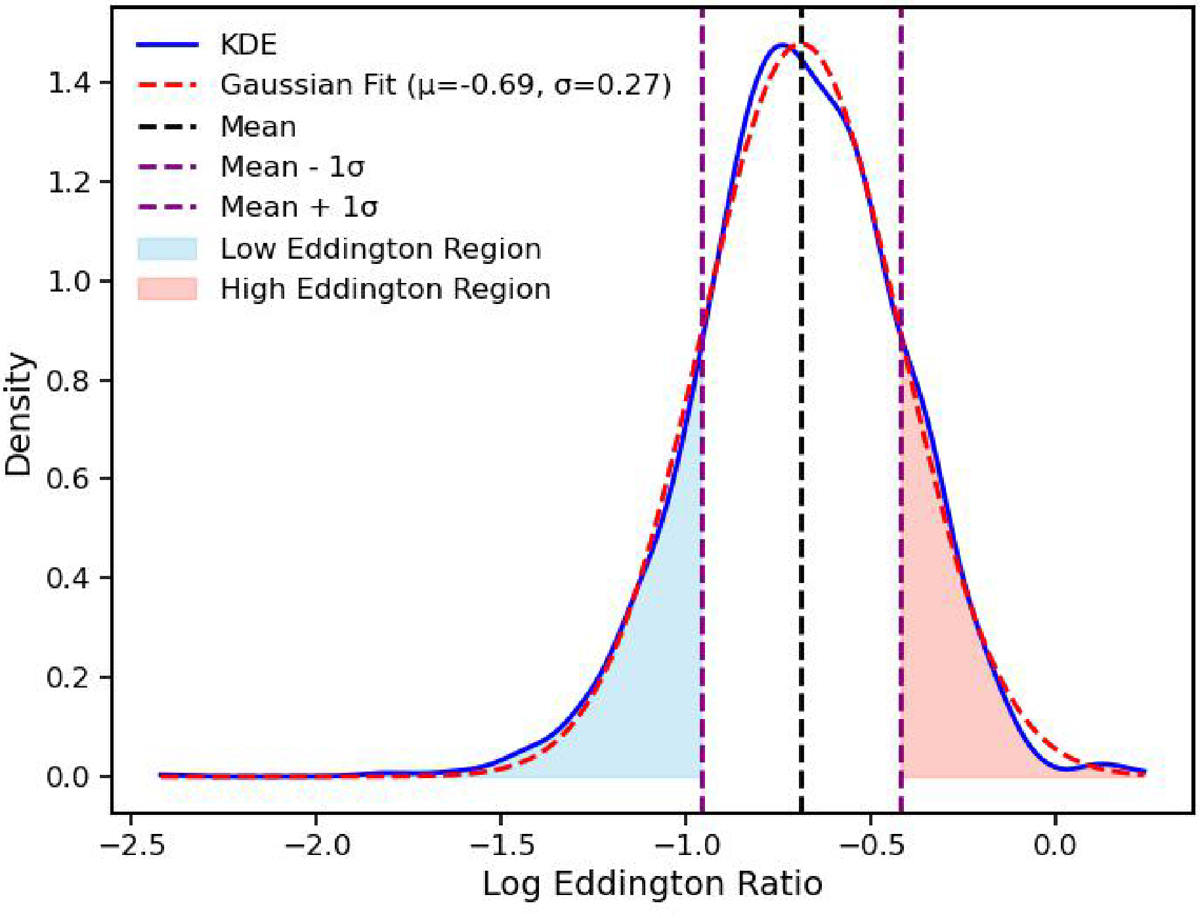
Distribution of Log Eddington ratio for the quasar sample, showing the kernel density estimation (KDE) curve (blue solid line) with an overlaid Gaussian fit (red dashed line). The vertical lines indicate the mean (black dashed line) and one-sigma deviation from the mean (purple dashed lines). The shaded sky blue region indicates the low Eddington ratio range, while the shaded pink region highlights the high Eddington ratio range, defining the boundaries used for sample selection.
Current usage metrics show cumulative count of Article Views (full-text article views including HTML views, PDF and ePub downloads, according to the available data) and Abstracts Views on Vision4Press platform.
Data correspond to usage on the plateform after 2015. The current usage metrics is available 48-96 hours after online publication and is updated daily on week days.
Initial download of the metrics may take a while.