Open Access
Fig. 6.
Download original image
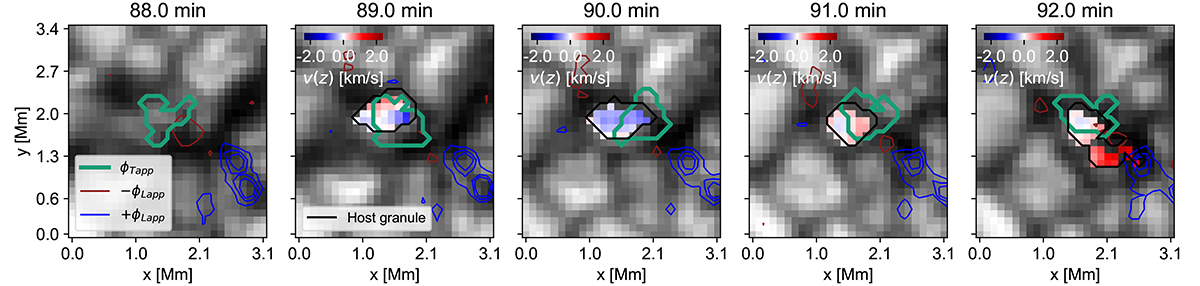
Case of a magnetic flux sheet emergence in a nascent and relatively small granule. The image series shows the continuum maps constructed from Hinode SP slit data. The plot set-up and information are as shown in Fig. 4.
Current usage metrics show cumulative count of Article Views (full-text article views including HTML views, PDF and ePub downloads, according to the available data) and Abstracts Views on Vision4Press platform.
Data correspond to usage on the plateform after 2015. The current usage metrics is available 48-96 hours after online publication and is updated daily on week days.
Initial download of the metrics may take a while.