Fig. 5.
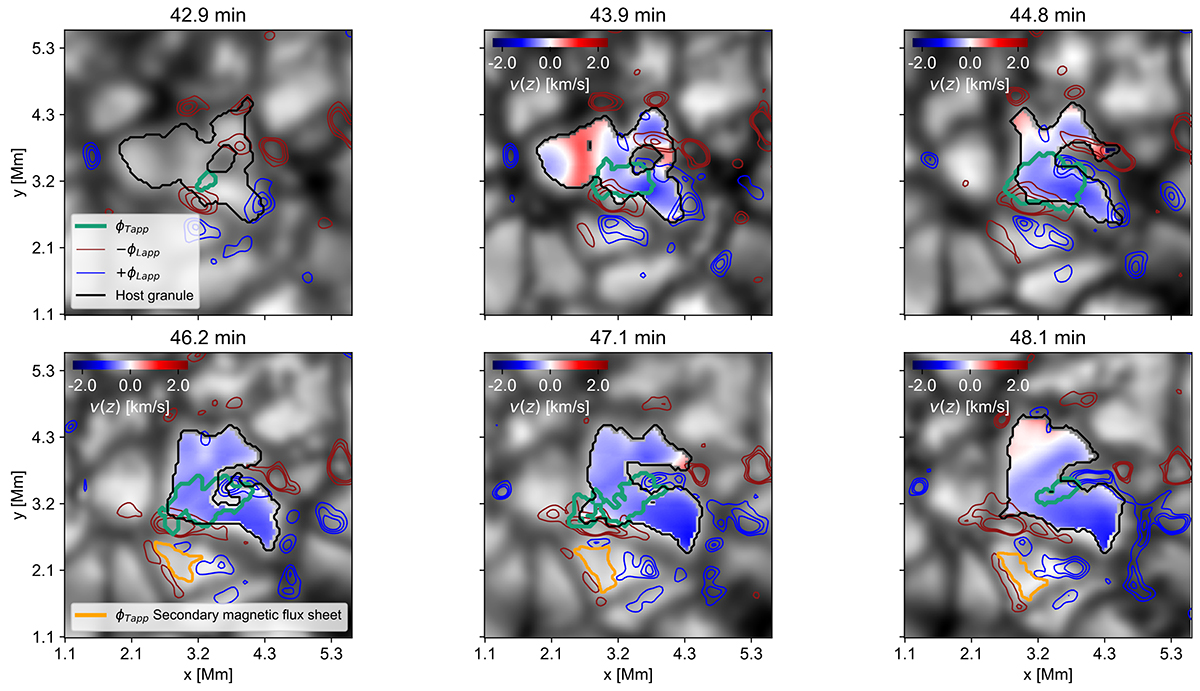
Download original image
Second case of magnetic flux sheet emergence in an exploding granule. The image series shows the continuum close to the Fe I 617.3 nm line recorded by CRISP. The plot set-up is defined as in Fig. 4. The blue (red) contours mark the positive (negative) polarity of the longitudinal magnetic flux density with thresholds of 40 Mx cm−2, 60 Mx cm−2 and 80 Mx cm−2. Black contours mark the host granule border. A secondary magnetic flux sheet, depicted by orange contours, was detected near and concurrently with the event within the exploding granule. Colour maps within the host granule show the distribution of the bisector velocity at 60% of the line depth.
Current usage metrics show cumulative count of Article Views (full-text article views including HTML views, PDF and ePub downloads, according to the available data) and Abstracts Views on Vision4Press platform.
Data correspond to usage on the plateform after 2015. The current usage metrics is available 48-96 hours after online publication and is updated daily on week days.
Initial download of the metrics may take a while.