Fig. 4.
Download original image
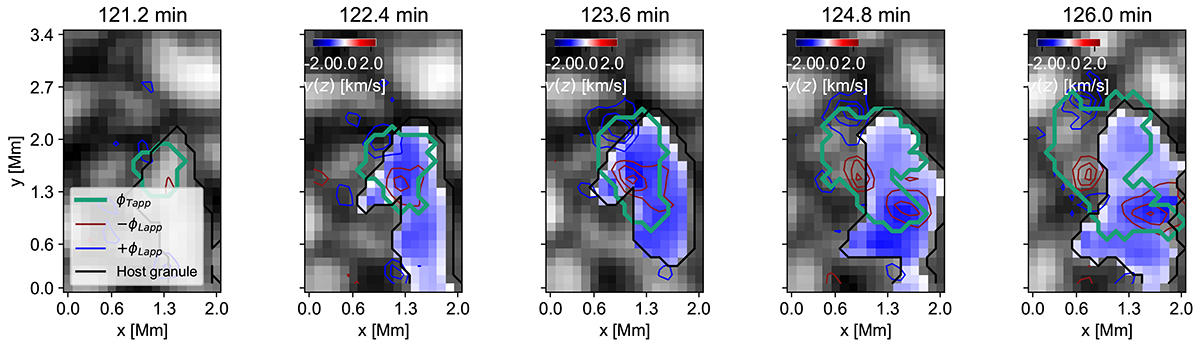
Magnetic flux sheet emergence event alongside the expansion of its host granule, which fragments as an exploding granule. The image series shows the continuum maps reconstructed from Hinode SP slit data. The times are indicated above the images. Contours mark the apparent transverse (pine green) and longitudinal (red contours for the negative polarity and blue contours for the positive polarity) magnetic flux density associated with the event. The magnetic flux density thresholds are defined as in Fig. 2. Black contours mark the host granule border. Colour maps within the host granule show the distribution of the bisector velocity at 70% of the line depth.
Current usage metrics show cumulative count of Article Views (full-text article views including HTML views, PDF and ePub downloads, according to the available data) and Abstracts Views on Vision4Press platform.
Data correspond to usage on the plateform after 2015. The current usage metrics is available 48-96 hours after online publication and is updated daily on week days.
Initial download of the metrics may take a while.