Fig. 2.
Download original image
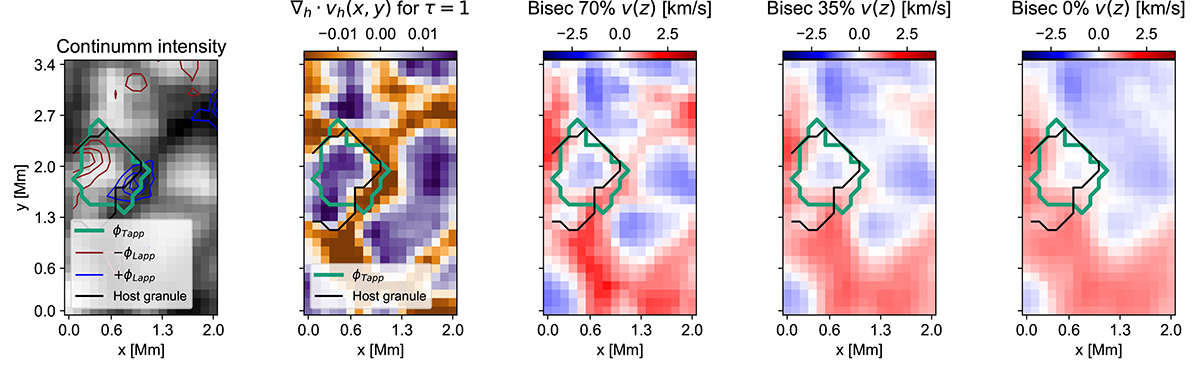
Magnetic flux sheet event with ID 352 recorded by Hinode SP on September 26 2007 at 08:15 UT. From left to right, the first panel shows the continuum intensity in the background with contours. Pine green contours mark a threshold of 130 Mx cm−2 for the apparent transverse magnetic flux density patch ϕTapp. The blue (red) contours mark the positive +ϕLapp (negative −ϕLapp) polarity of the longitudinal magnetic flux density with thresholds of 20 Mx cm−2, 40 Mx cm−2 and 60 Mx cm−2. The black contours mark a single closed contour of zero-divergence defined as the boundary of the host granule. The second panel shows the divergence of the apparent horizontal velocity field marking the corresponding location of the sheet represented by the transverse magnetic flux density patch ϕTapp (pine green contour) and the boundary of the host granule (black contour). Finally, the third, fourth, and fifth panels show the bisector velocity field for the three different depth positions: 70%, 35%, and core (0%) of the Fe I 630.15 nm line corresponding roughly to the low, middle, and high photosphere, respectively.
Current usage metrics show cumulative count of Article Views (full-text article views including HTML views, PDF and ePub downloads, according to the available data) and Abstracts Views on Vision4Press platform.
Data correspond to usage on the plateform after 2015. The current usage metrics is available 48-96 hours after online publication and is updated daily on week days.
Initial download of the metrics may take a while.