Fig. 12.
Download original image
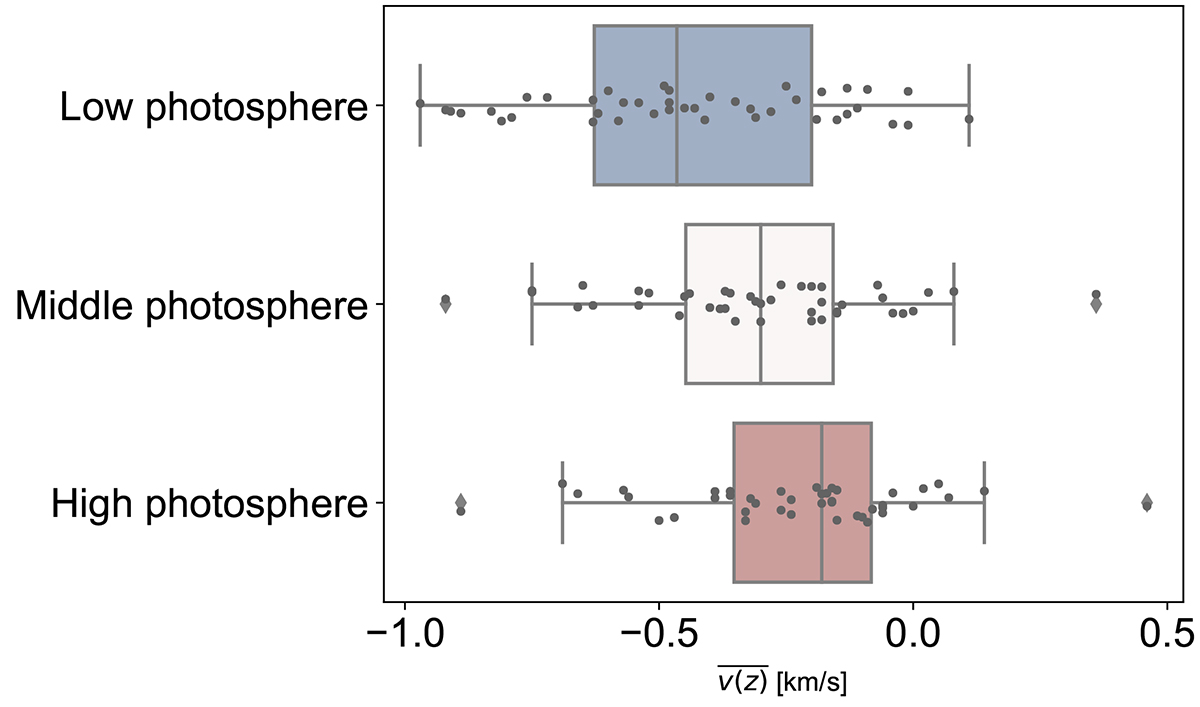
Average vertical velocity at different heights of the photosphere of the host granules during the emergence of their associated magnetic flux sheet. The box plots display the full distribution (scatter points), maximum and minimum values (whiskers lines), the interquartile range (box), upper and lower quartiles (box boundaries), and the median value (line within the box) for each height: low photosphere (blue box), middle photosphere (white box), and high photosphere (red box).
Current usage metrics show cumulative count of Article Views (full-text article views including HTML views, PDF and ePub downloads, according to the available data) and Abstracts Views on Vision4Press platform.
Data correspond to usage on the plateform after 2015. The current usage metrics is available 48-96 hours after online publication and is updated daily on week days.
Initial download of the metrics may take a while.