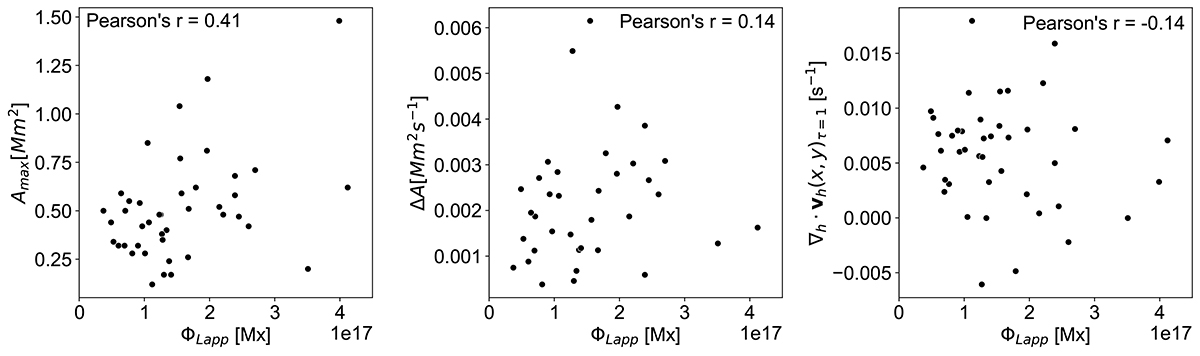
Fig. 11.
Download original image
Scatter plots comparing the total longitudinal magnetic flux of the sheet, ΦLapp, to the apparent maximum area of the sheet Amax (left panel), the rate of change of the magnetic flux sheet area ΔA (central panel), and the divergence of the horizontal flow field within the sheet ∇h ⋅ vh(x, y)τ = 1 (right panel). The Pearson correlation coefficient is shown in each panel. See Table B.1 (Cols. 5, 6, 9) for numerical values.
Current usage metrics show cumulative count of Article Views (full-text article views including HTML views, PDF and ePub downloads, according to the available data) and Abstracts Views on Vision4Press platform.
Data correspond to usage on the plateform after 2015. The current usage metrics is available 48-96 hours after online publication and is updated daily on week days.
Initial download of the metrics may take a while.