Fig. 1.
Download original image
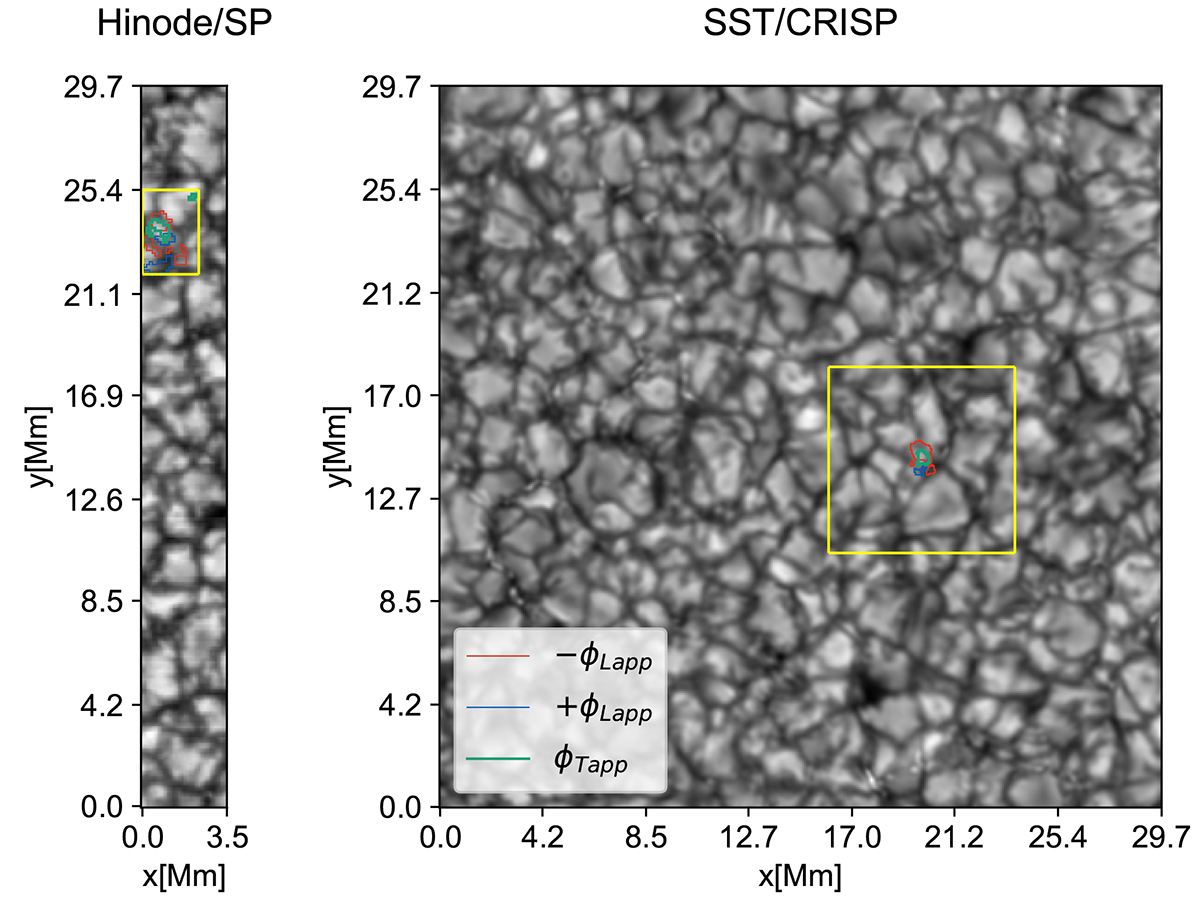
Representative snapshots of two distinct cases of emerging magnetic flux sheets. Left: Hinode SP full-sized and reconstructed image from slit data in the continuum of the Fe I 630.2 nm line pair with a FoV of ![]() recorded on October 22 2007 at 18:34 UT. Right: Image of the CRISP instrument in the continuum of the Fe I 630.2 nm line recorded on August 06 2011. The FoV is about 41″ × 41″ cut from the original size of 57″ × 57″ to fit with the Hinode SP image. The scale is presented in megametres [Mm]. Yellow boxes mark the location of a detected event in each particular dataset: event ID 523 for the Hinode SP image and event ID 53961 for the CRISP image, respectively. Green, red, and blue contours indicate the apparent transverse magnetic flux, the negative longitudinal magnetic flux, and the positive longitudinal magnetic flux, respectively.
recorded on October 22 2007 at 18:34 UT. Right: Image of the CRISP instrument in the continuum of the Fe I 630.2 nm line recorded on August 06 2011. The FoV is about 41″ × 41″ cut from the original size of 57″ × 57″ to fit with the Hinode SP image. The scale is presented in megametres [Mm]. Yellow boxes mark the location of a detected event in each particular dataset: event ID 523 for the Hinode SP image and event ID 53961 for the CRISP image, respectively. Green, red, and blue contours indicate the apparent transverse magnetic flux, the negative longitudinal magnetic flux, and the positive longitudinal magnetic flux, respectively.
Current usage metrics show cumulative count of Article Views (full-text article views including HTML views, PDF and ePub downloads, according to the available data) and Abstracts Views on Vision4Press platform.
Data correspond to usage on the plateform after 2015. The current usage metrics is available 48-96 hours after online publication and is updated daily on week days.
Initial download of the metrics may take a while.