Fig. 3
Download original image
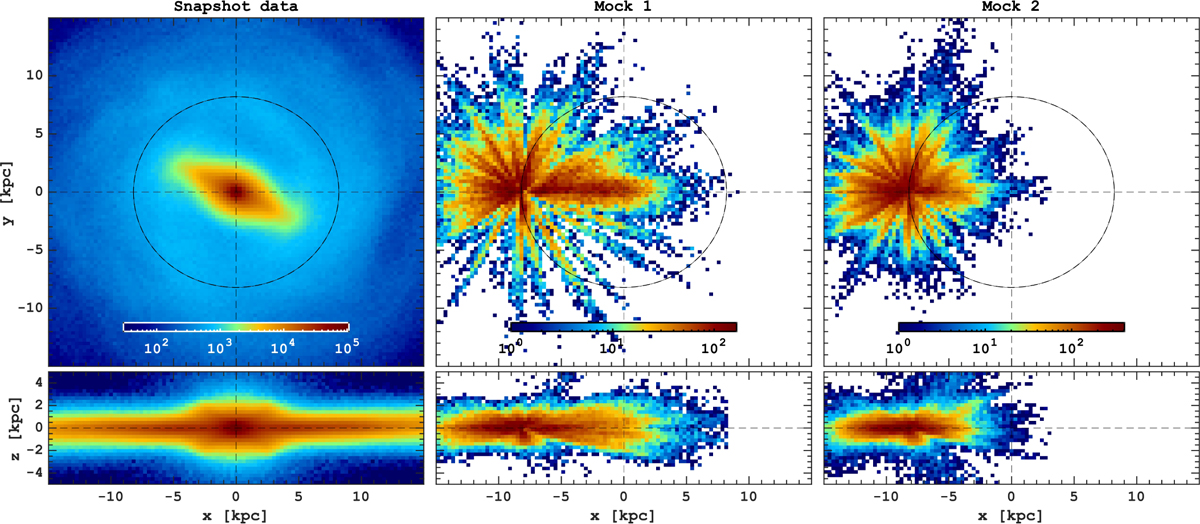
Initial selection of star particles from the simulation mimicking the APOGEE footprint. In the left panel, the surface density of all star particles in the snapshot is shown. The middle and right panels show two mock catalogues which qualitatively reproduce the APOGEE DR17 giants (Mock 1) and red clump (Mock 2) stars footprints, respectively (see Sect. 2.3 for details). The number of star particles in the snapshot is 7.343.898, while the APOGEE-like selections include 40.354 (Mock 1) and 39.596 (Mock 2). In all the panels, the bar orientation is chosen to be 27∘ relative to the horizontal axis, reproducing the MW bar positioning.
Current usage metrics show cumulative count of Article Views (full-text article views including HTML views, PDF and ePub downloads, according to the available data) and Abstracts Views on Vision4Press platform.
Data correspond to usage on the plateform after 2015. The current usage metrics is available 48-96 hours after online publication and is updated daily on week days.
Initial download of the metrics may take a while.