Fig. 11
Download original image
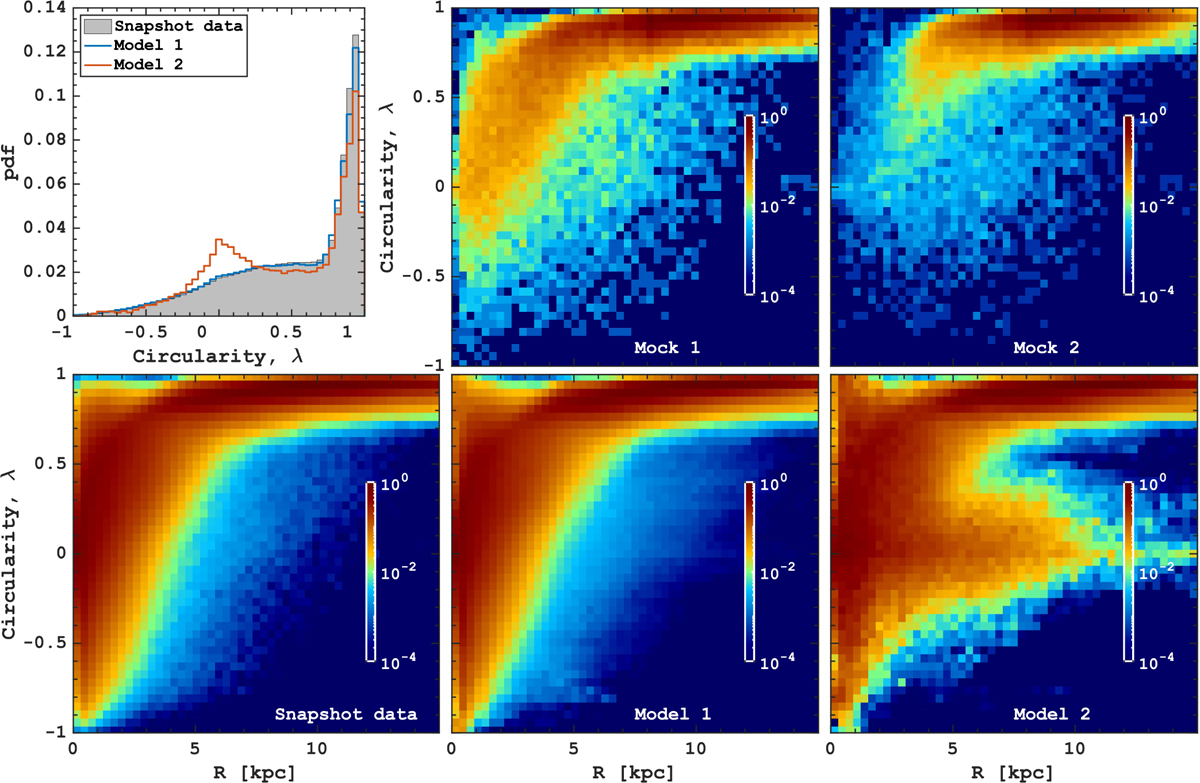
Reconstruction of circularity distribution as a function of the galactocentric distance. Similar to Fig. 10, the panels illustrate the circularity distribution as a function of galactocentric distance in the mock selections (top) and the results of orbit superposition (bottom), compared to the snapshot data (bottom left). The top left panel displays the circularity distribution obtained in the orbit superposition (blue and red for Model 1 and 2, respectively) compared to the snapshot data (grey).
Current usage metrics show cumulative count of Article Views (full-text article views including HTML views, PDF and ePub downloads, according to the available data) and Abstracts Views on Vision4Press platform.
Data correspond to usage on the plateform after 2015. The current usage metrics is available 48-96 hours after online publication and is updated daily on week days.
Initial download of the metrics may take a while.