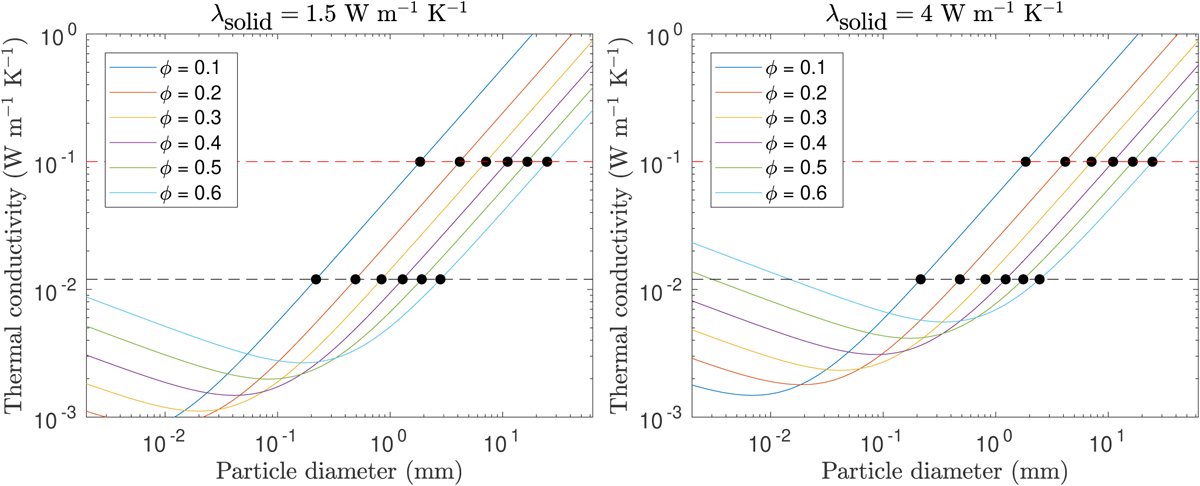
Fig. 6

Download original image
Regolith particles diameter for different filling factors ϕ. The horizontal dashed black line corresponds to the nominal estimate of K of 0.012 W m−1 K−1, the dashed red line to the upper limit of 0.1 W m−1 K−1, and the colored curves depict the dependency of the thermal conductivity as a function of the regolith particle diameter. The conductivity of solid material was assumed to be λsolid = 1.5 W m−1 K−1 for the plot on the left, and λsolid = 4 W m−1 K−1 for the plot on the right. The intersections between the horizontal dashed lines and the curves, indicated by black circles, correspond to the estimated grain size.
Current usage metrics show cumulative count of Article Views (full-text article views including HTML views, PDF and ePub downloads, according to the available data) and Abstracts Views on Vision4Press platform.
Data correspond to usage on the plateform after 2015. The current usage metrics is available 48-96 hours after online publication and is updated daily on week days.
Initial download of the metrics may take a while.


