Fig. 4
Download original image
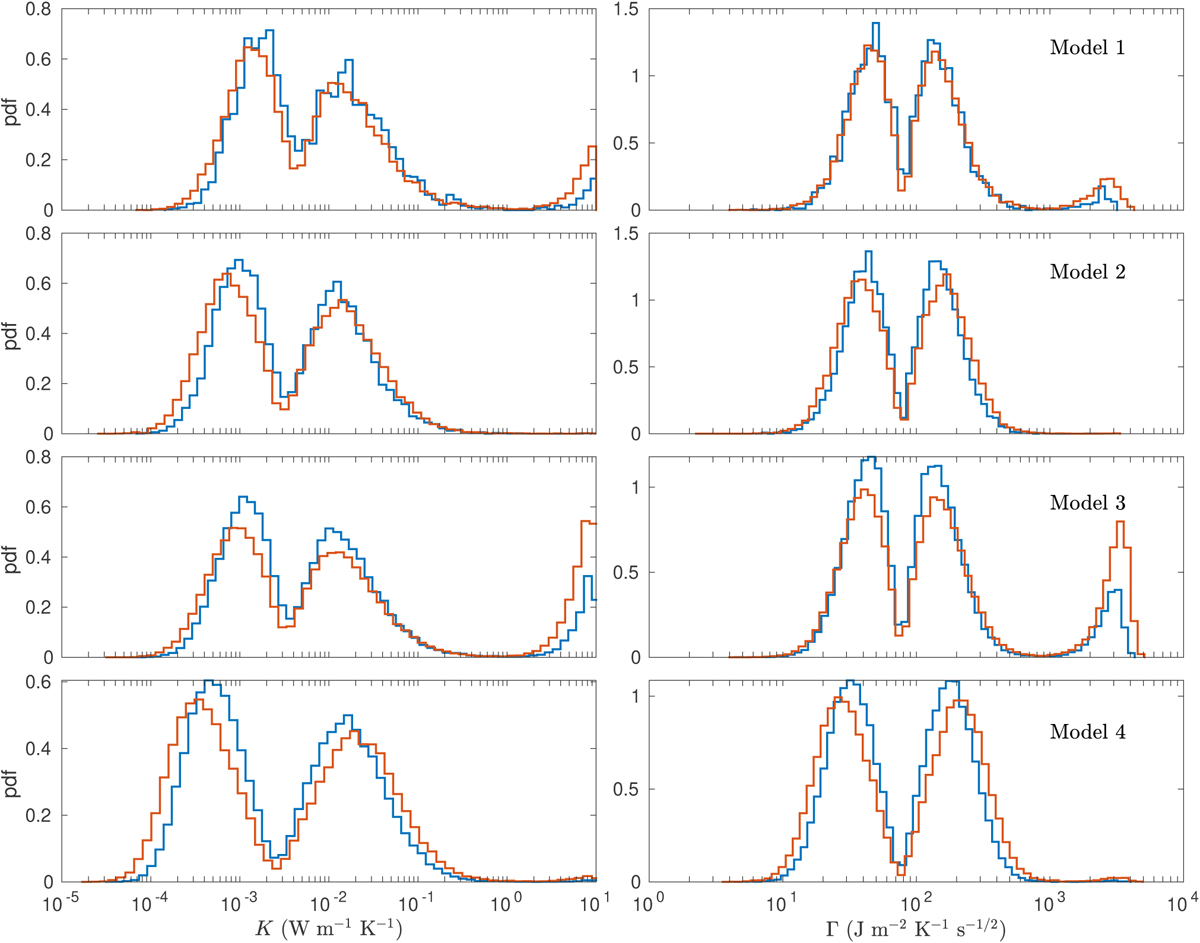
Distribution of thermal conductivity K (left columns) and thermal inertia Γ (right column) of Kamo’oalewa, obtained with the ASTERIA method. Different rows correspond to different physical parameter modeling listed in Table 2. Blue histograms correspond to results obtained with the nominal orbit solution of Table 3. Red histograms are results obtained with the lower S/N Yarkovsky detection of A2 = (−136.28 ± 15.82) × 10−15 au d−2, which does not take into account the measured astrometric errors for specific observations.
Current usage metrics show cumulative count of Article Views (full-text article views including HTML views, PDF and ePub downloads, according to the available data) and Abstracts Views on Vision4Press platform.
Data correspond to usage on the plateform after 2015. The current usage metrics is available 48-96 hours after online publication and is updated daily on week days.
Initial download of the metrics may take a while.