Fig. 2
Download original image
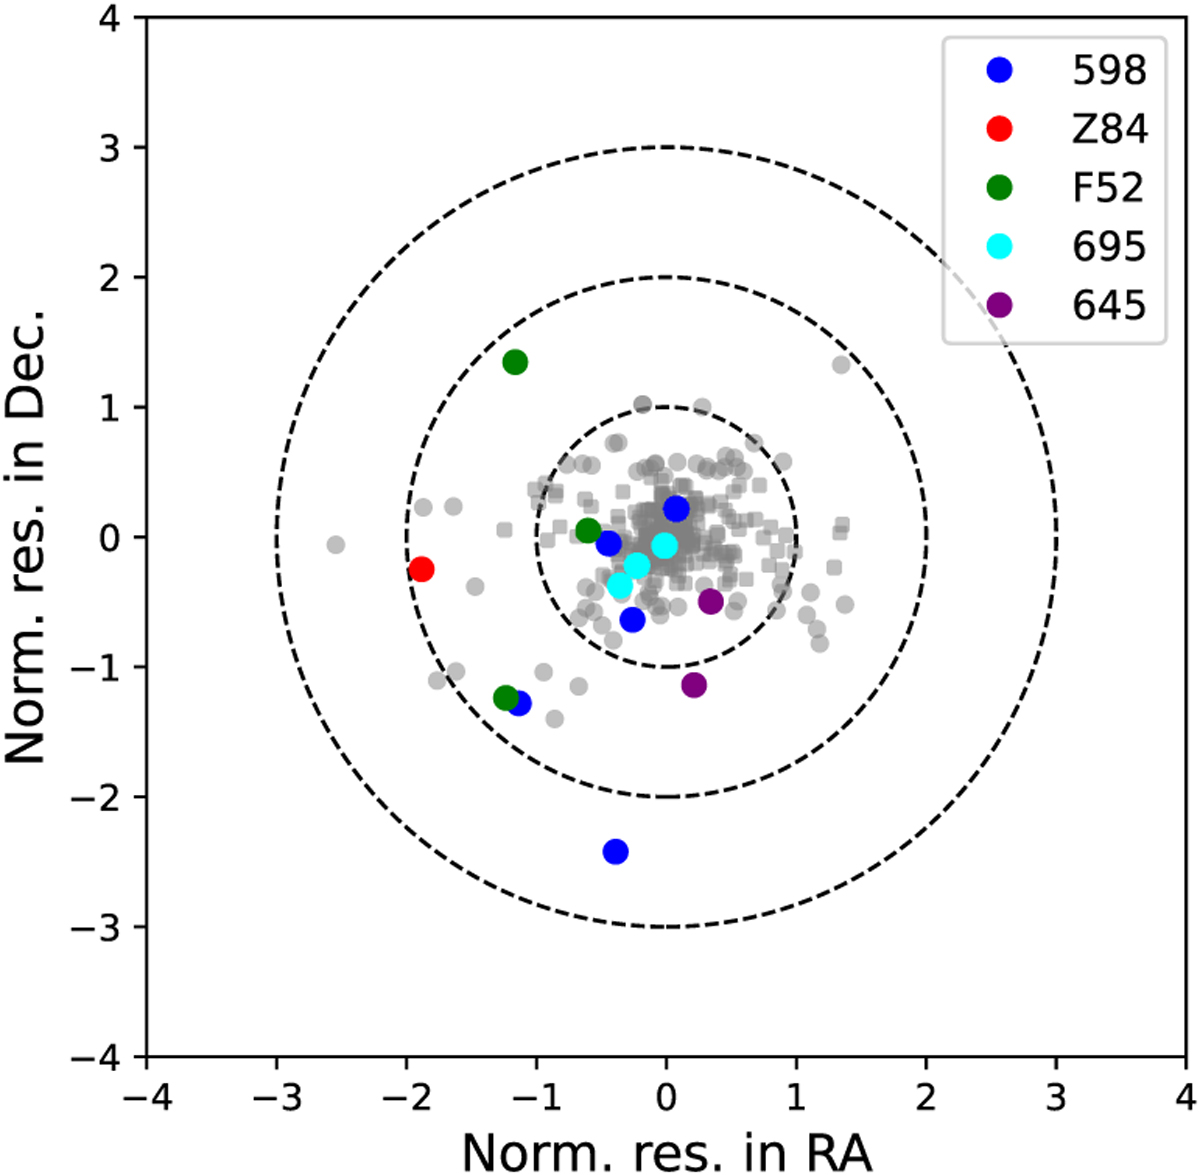
Distribution of the post-fit residuals in RA and Dec, normalized by their post-fit astrometric error. Blue and red dots correspond to observations taken in this work from 568 and Z84, respectively. Green and cyan dots correspond to observations from F52 and 695, respectively, taken in 2024. Violet dots correspond to re-measurements of images from 645. Dashed circles represent values of χ equal to 3, 2, and 1.
Current usage metrics show cumulative count of Article Views (full-text article views including HTML views, PDF and ePub downloads, according to the available data) and Abstracts Views on Vision4Press platform.
Data correspond to usage on the plateform after 2015. The current usage metrics is available 48-96 hours after online publication and is updated daily on week days.
Initial download of the metrics may take a while.