Fig. 7
Download original image
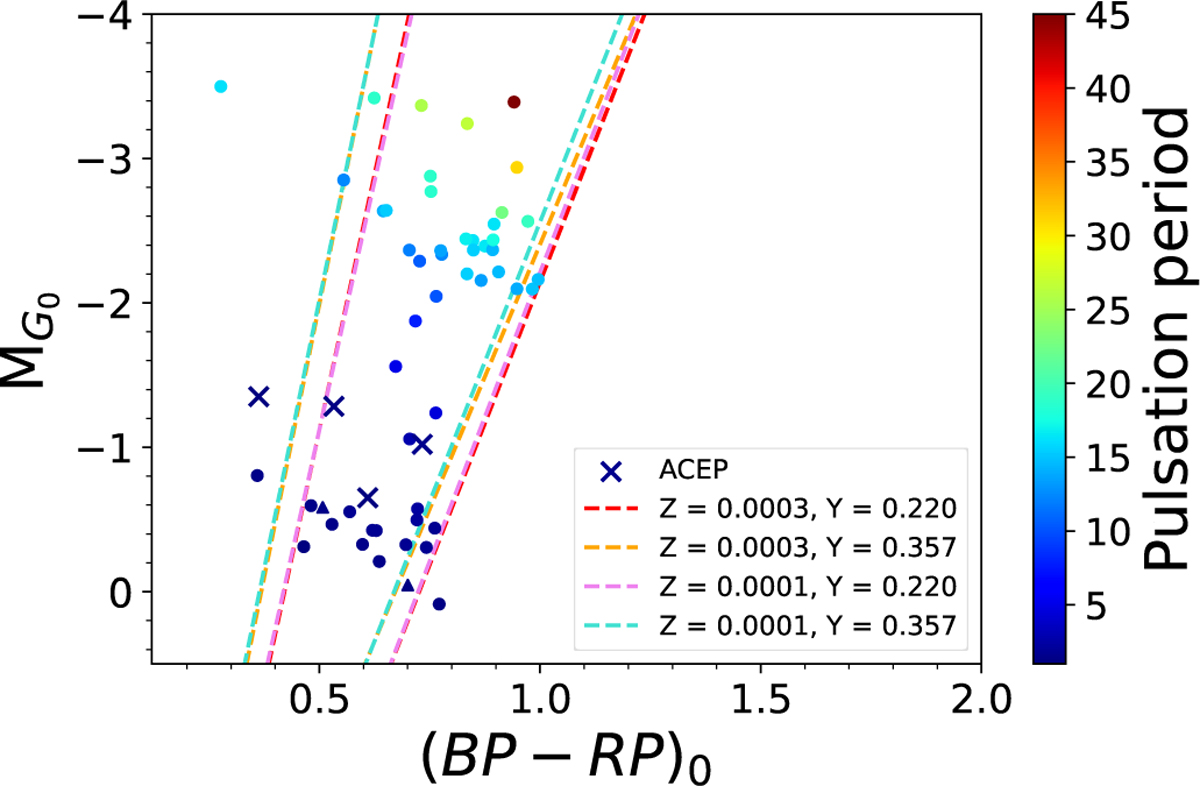
Comparison of the T2CEP models with the T2CEPs in our sample. The triangles represent stars pulsating in the first overtone (based on the Gaia classification), and the dots represent the stars pulsating in the fundamental mode. Anomalous Cepheids are marked with the symbol ×. The dotted lines are used to indicate the boundaries of the IS as defined by the models. The best-fitting models for the majority of Cepheids are shown in red, whereas those fitting the least are in turquoise. The percentage of stars within the boundaries of each model is given in Table A.3.
Current usage metrics show cumulative count of Article Views (full-text article views including HTML views, PDF and ePub downloads, according to the available data) and Abstracts Views on Vision4Press platform.
Data correspond to usage on the plateform after 2015. The current usage metrics is available 48-96 hours after online publication and is updated daily on week days.
Initial download of the metrics may take a while.