Open Access
Fig. 5
Download original image
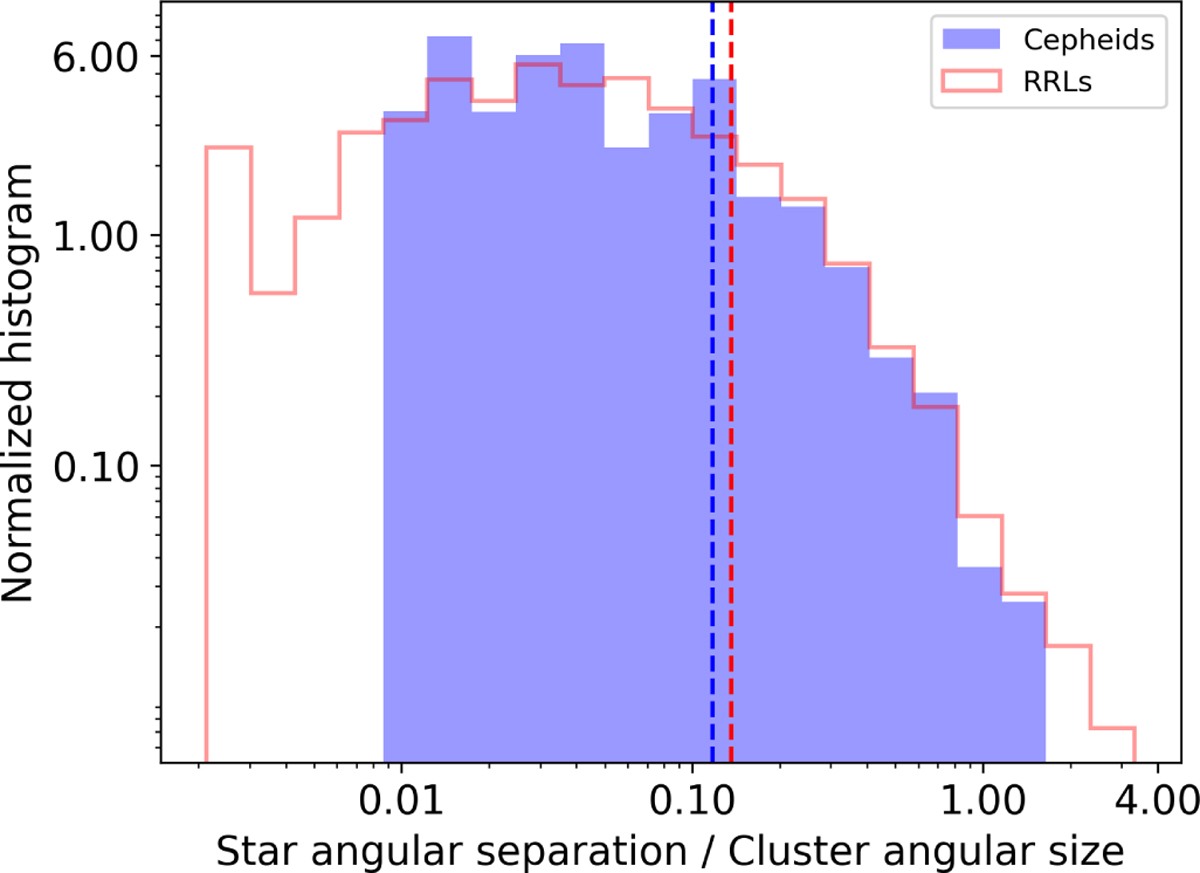
Normalized histogram showing the angular distance of a star from the cluster center, divided by the angular size of the host cluster. The vertical lines correspond to the median separation for each distribution. The histogram only shows clusters that host both Cepheids and RRLs.
Current usage metrics show cumulative count of Article Views (full-text article views including HTML views, PDF and ePub downloads, according to the available data) and Abstracts Views on Vision4Press platform.
Data correspond to usage on the plateform after 2015. The current usage metrics is available 48-96 hours after online publication and is updated daily on week days.
Initial download of the metrics may take a while.