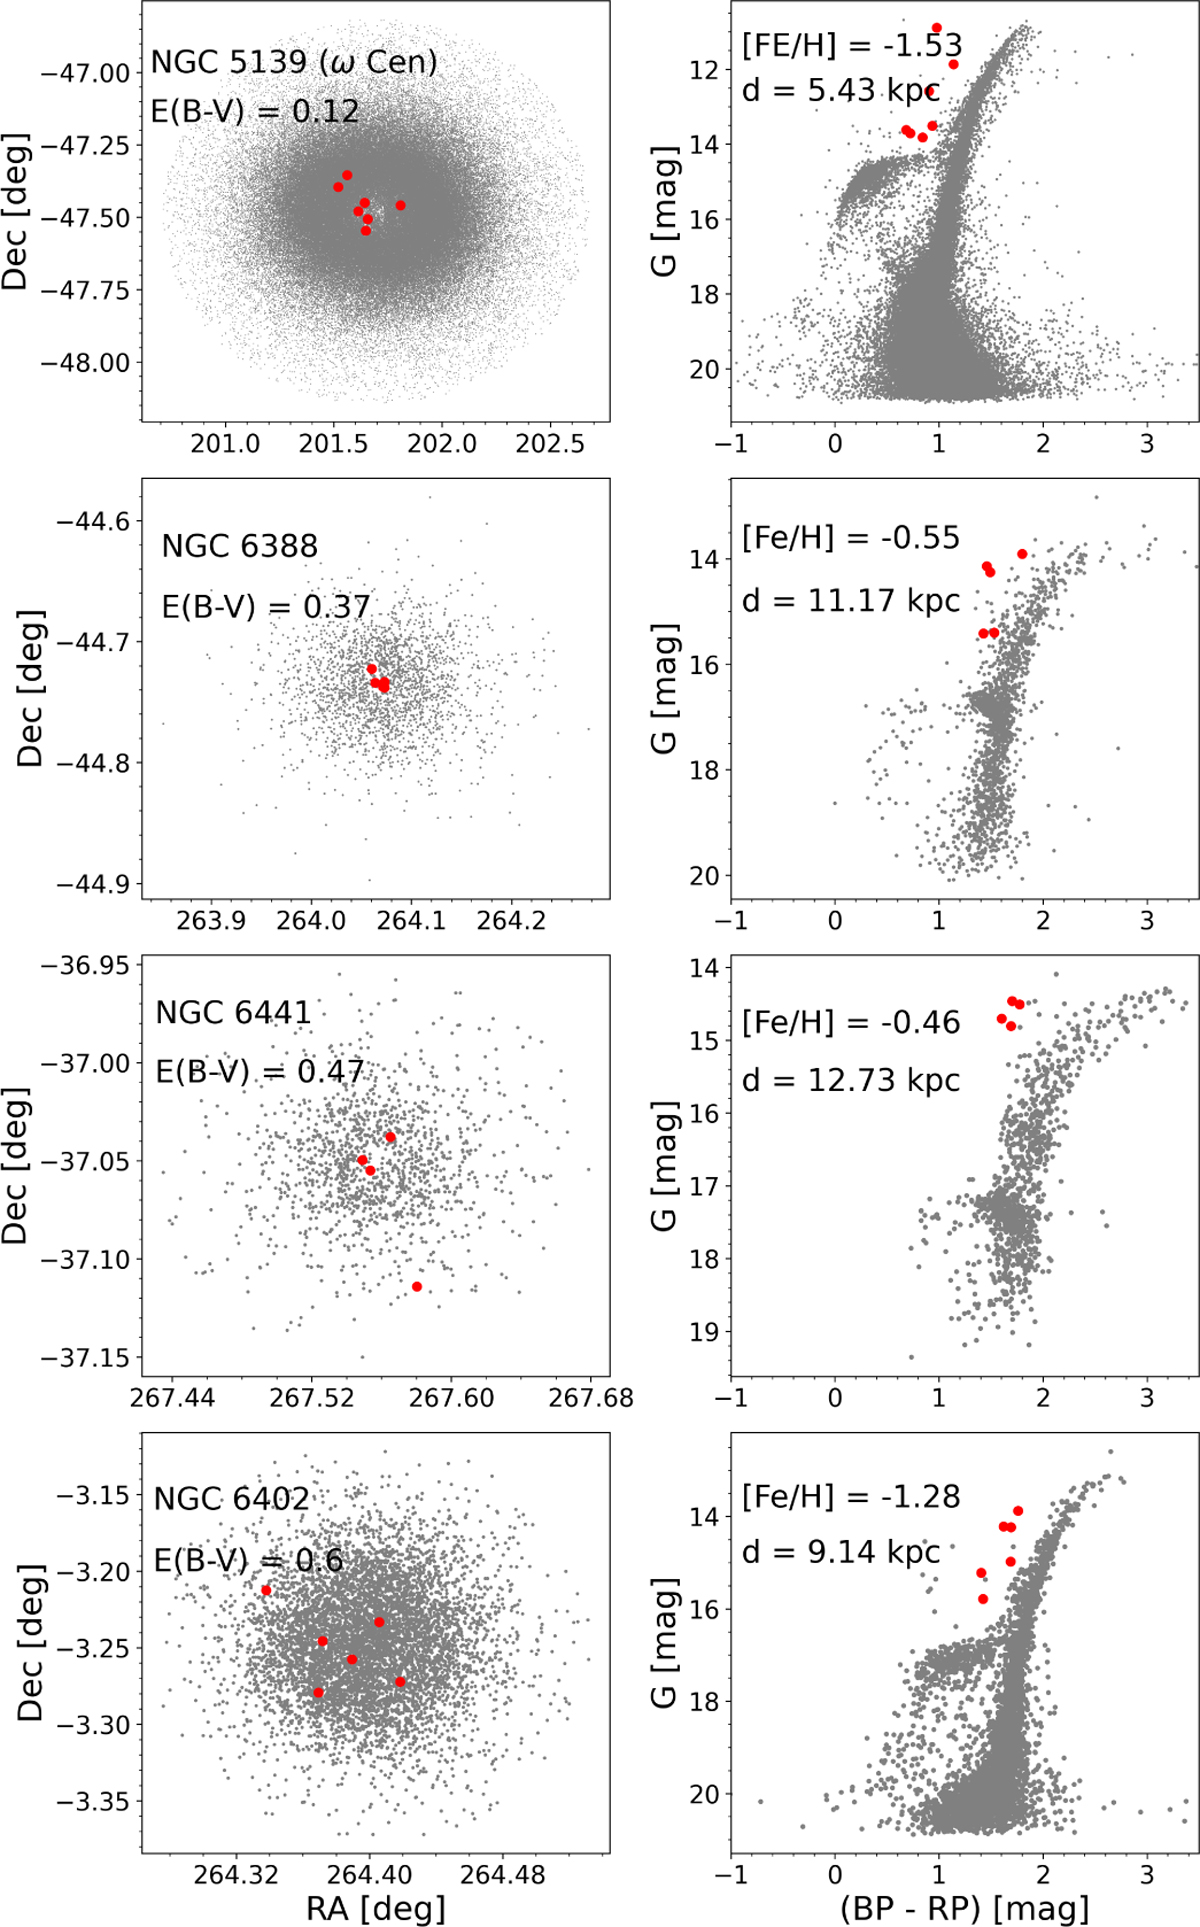
Fig. 4
Download original image
Clusters with the highest number of Cepheids. Cluster members are represented with gray dots and Cepheids with red dots. The left panel illustrates the location of the Cepheids within the cluster, while the right panel shows their color-magnitude diagram. Interestingly, in the first three clusters, the Cepheids are preferentially located close to the cluster center.
Current usage metrics show cumulative count of Article Views (full-text article views including HTML views, PDF and ePub downloads, according to the available data) and Abstracts Views on Vision4Press platform.
Data correspond to usage on the plateform after 2015. The current usage metrics is available 48-96 hours after online publication and is updated daily on week days.
Initial download of the metrics may take a while.