Fig. 2
Download original image
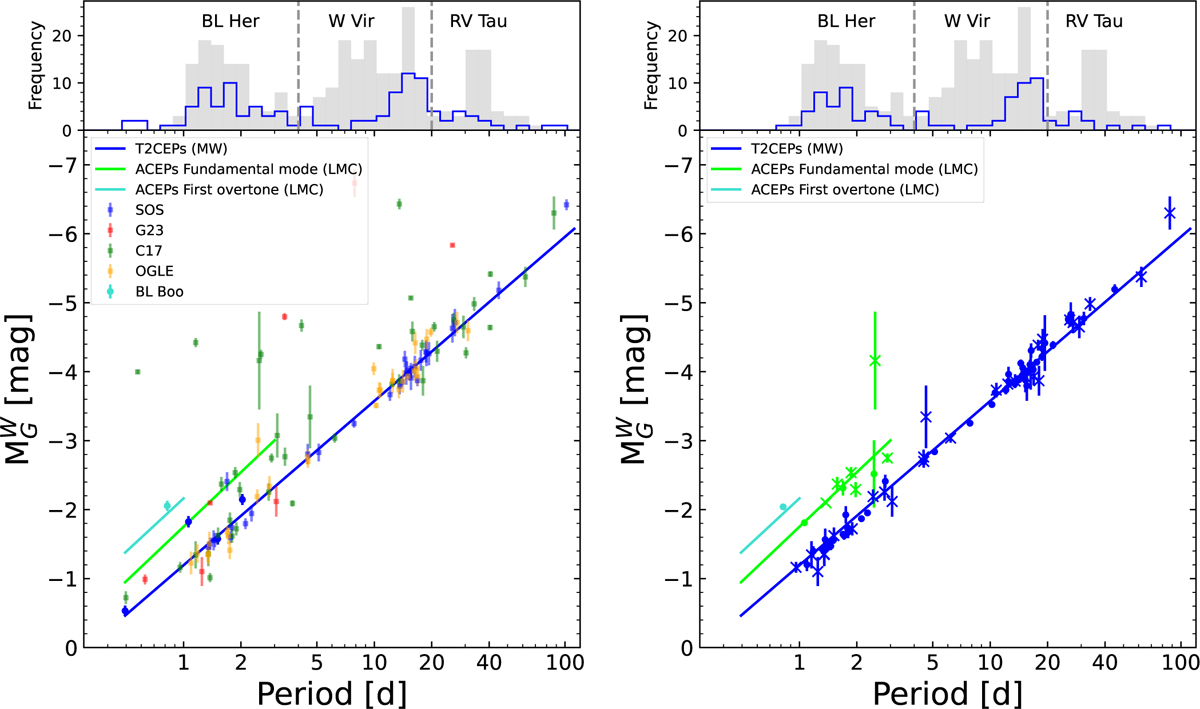
Absolute magnitude of Cepheids in GCs in the Gaia Wesenheit magnitude compared with the period-luminosity relations derived by Ripepi et al. (2019). The period-luminosity relation for T2CEPs is shown in blue, for fundamental-mode ACEPs in lime, and for first overtone ACEPs in turquoise. In the left panel, the absolute magnitudes were computed using photometry from the source catalog and pulsation periods from Gaia. In the absence of OGLE or Gaia periods, we use those from the literature. The right panel shows the updated classification: dots indicate cases with available SOS photometry, and crosses represent cases where only the source catalog photometry was available. The blue, non-filled histogram at the top includes all Cepheids in clusters, regardless of their subclassification or pulsation type. The gray histogram shows the T2CEPs detected by the OGLE collaboration in the LMC (Soszyński et al. 2018).
Current usage metrics show cumulative count of Article Views (full-text article views including HTML views, PDF and ePub downloads, according to the available data) and Abstracts Views on Vision4Press platform.
Data correspond to usage on the plateform after 2015. The current usage metrics is available 48-96 hours after online publication and is updated daily on week days.
Initial download of the metrics may take a while.