Open Access
Fig. 1
Download original image
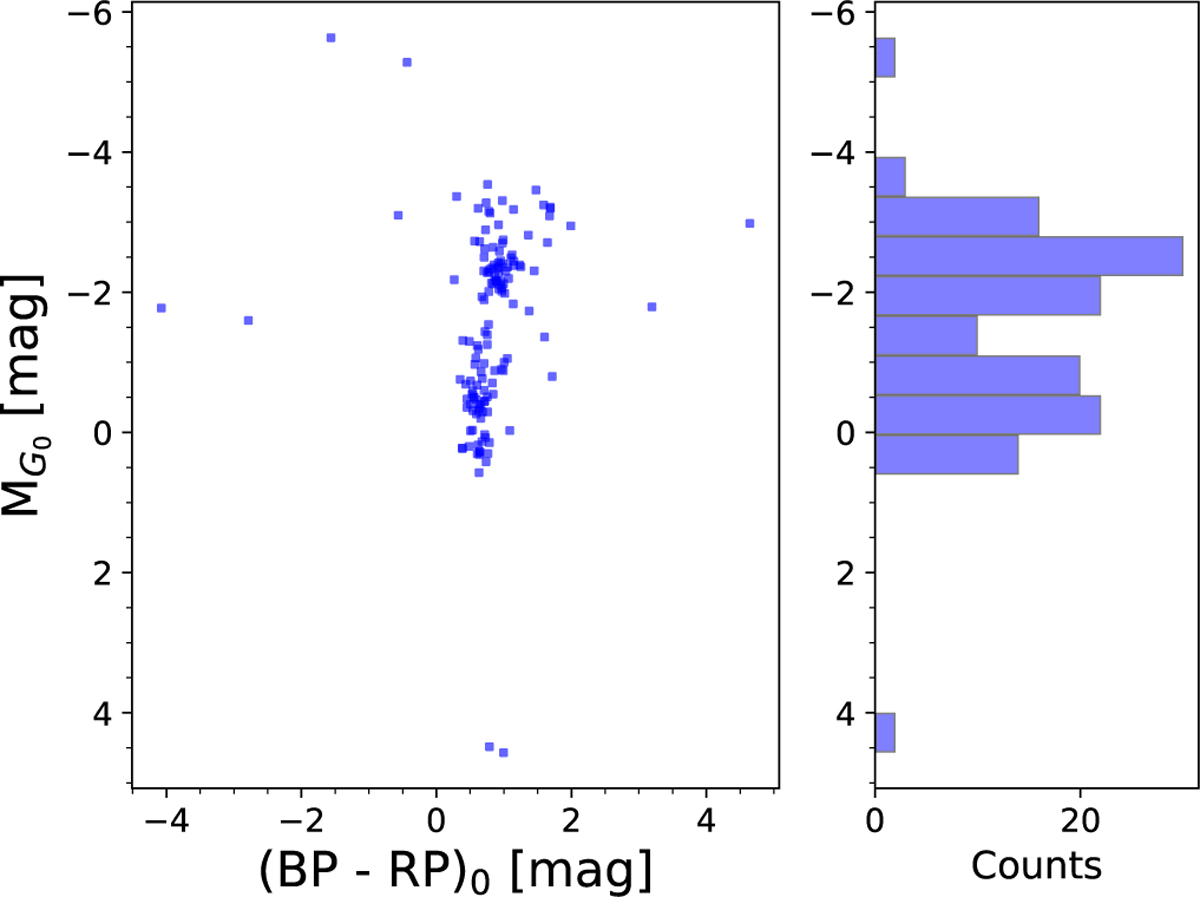
Color-magnitude diagram of the Cepheids in our sample. The histogram on the right shows the number of stars as a function of absolute magnitude in G. Out of the 158 stars in the initial sample, only 141 appear in the plot, as BP or RP photometry is unavailable for 17 of them.
Current usage metrics show cumulative count of Article Views (full-text article views including HTML views, PDF and ePub downloads, according to the available data) and Abstracts Views on Vision4Press platform.
Data correspond to usage on the plateform after 2015. The current usage metrics is available 48-96 hours after online publication and is updated daily on week days.
Initial download of the metrics may take a while.