Fig. A.3.
Download original image
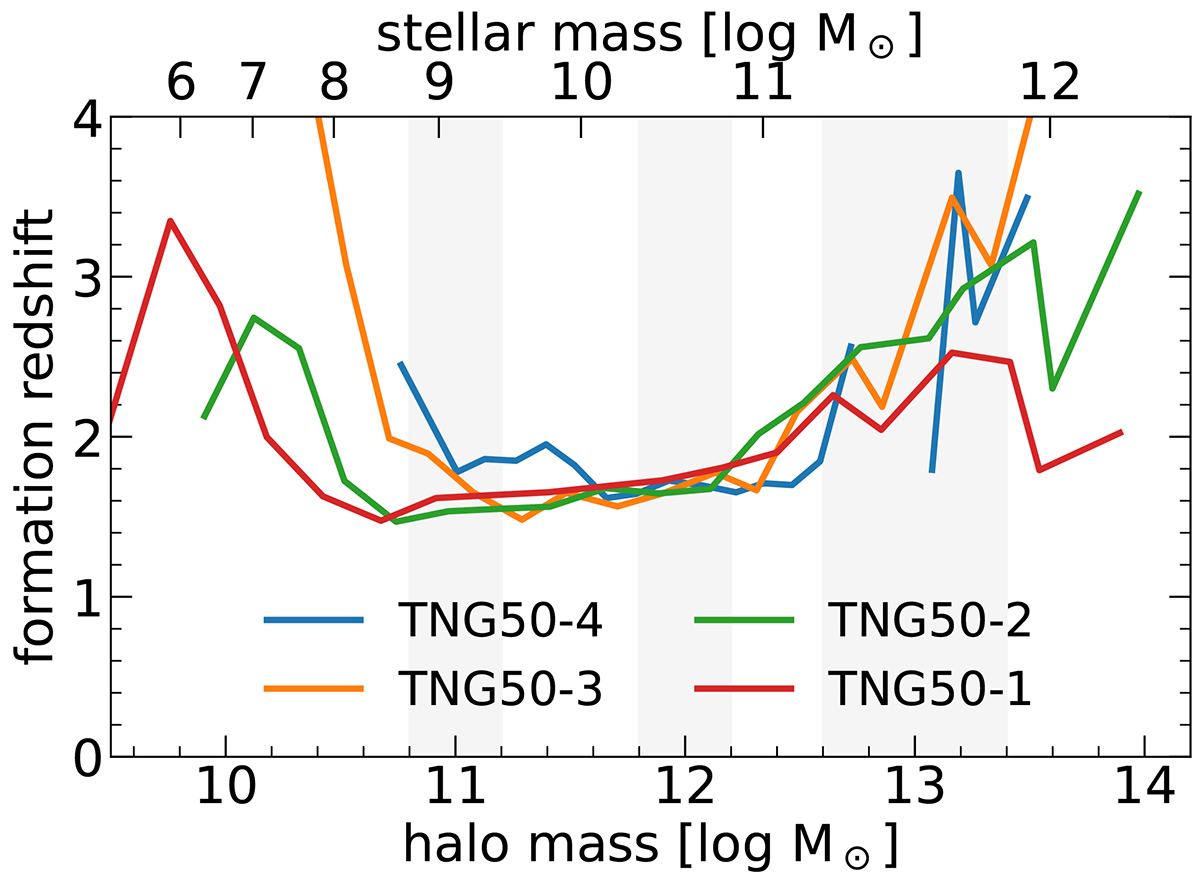
Comparison of the in situ stellar content (compare Fig. 9) for different TNG50 resolution runs. The red line indicates TNG50-1 with the highest resolution, green stands for TNG50-2, orange is for TNG50-3, and the blue line represents TNG50-4 with the lowest resolution. The figure spans to lower masses to better visualize resolution effects.
Current usage metrics show cumulative count of Article Views (full-text article views including HTML views, PDF and ePub downloads, according to the available data) and Abstracts Views on Vision4Press platform.
Data correspond to usage on the plateform after 2015. The current usage metrics is available 48-96 hours after online publication and is updated daily on week days.
Initial download of the metrics may take a while.