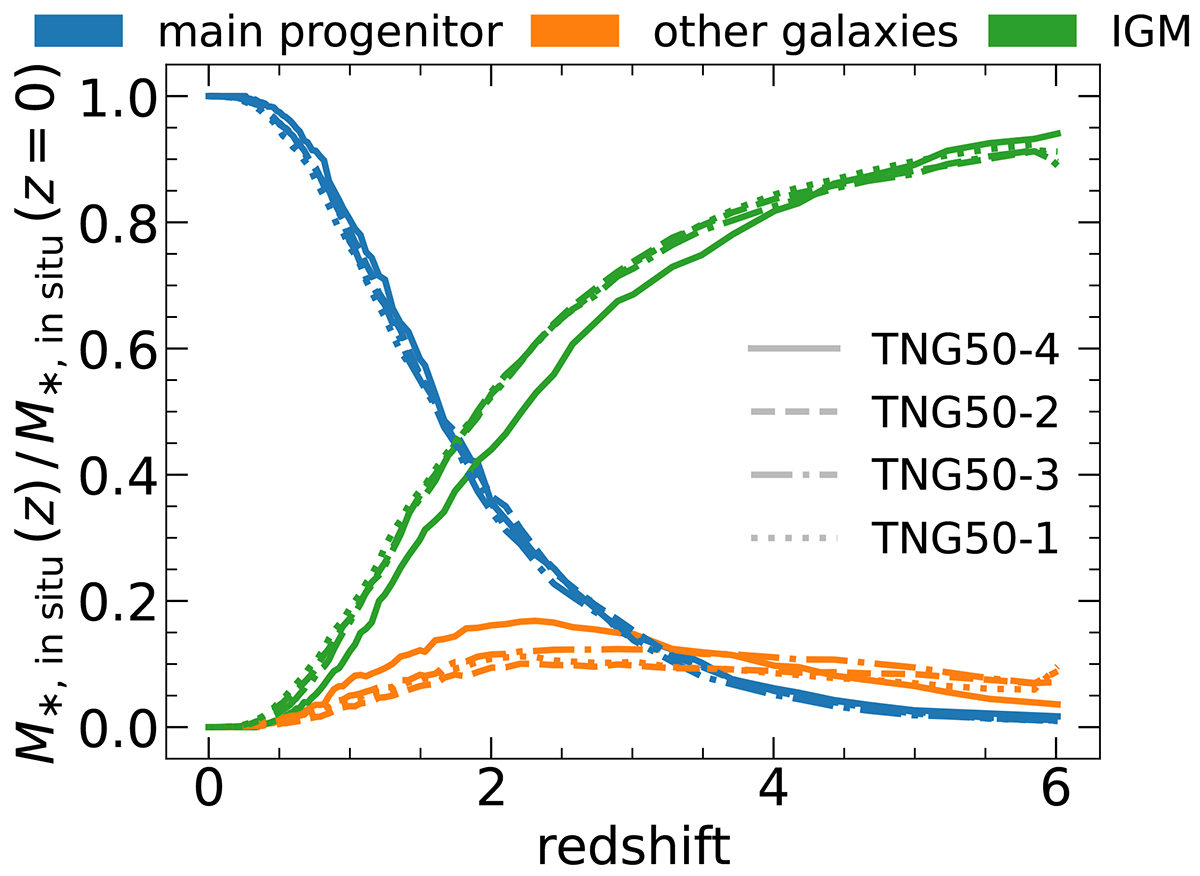
Fig. A.1.
Download original image
Comparison of Fig. 5 for different TNG50 resolution runs. The solid line indicates TNG50-4, the dash-dotted line TNG50-3, the dashed line TNG50-2, and the dotted line TNG50-1. The blue color represents the in situ stellar mass fraction of Milky Way-like central galaxies for tracers in the main progenitor, orange is the mass fraction for tracers in other galaxies, and green is the mass fraction for tracers in the IGM.
Current usage metrics show cumulative count of Article Views (full-text article views including HTML views, PDF and ePub downloads, according to the available data) and Abstracts Views on Vision4Press platform.
Data correspond to usage on the plateform after 2015. The current usage metrics is available 48-96 hours after online publication and is updated daily on week days.
Initial download of the metrics may take a while.