Fig. 5.
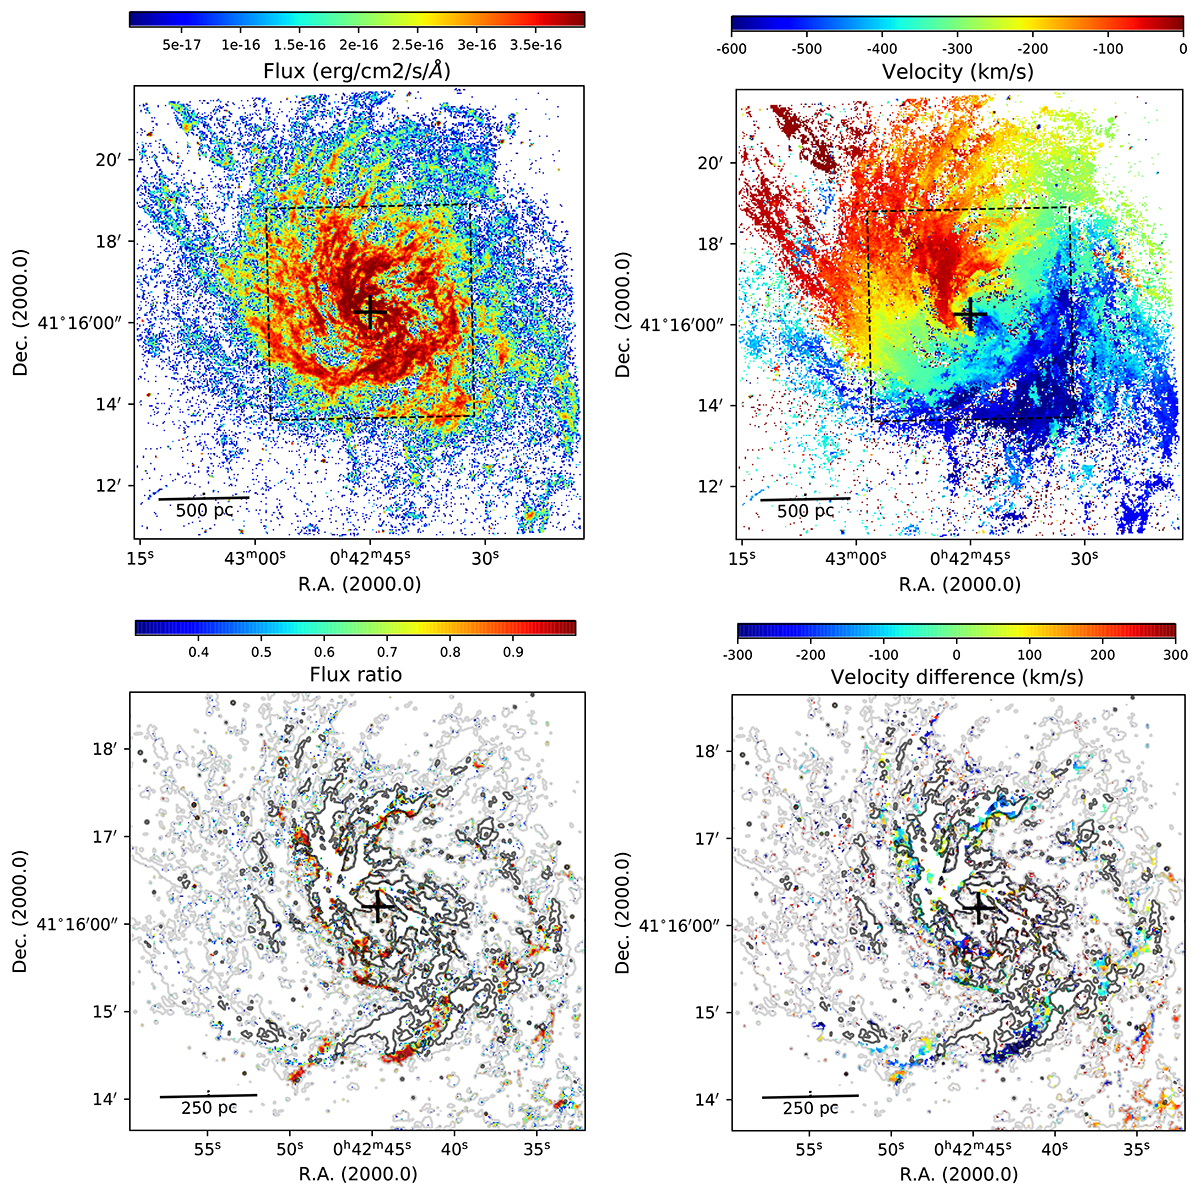
Download original image
Intensity and kinematic information extracted from the ionized gas with SITELLE SN3 data cube. Top panels: Ionized gas intensity (left) and the heliocentric velocity (right) corresponding to the main velocity component. The ionized gas intensity has a threshold of 6 × 10⁻¹⁸ erg cm−2 s−1 Å−1. The dashed squares correspond to the field of view displayed in the bottom panels. Bottom panels: Flux ratio ϕ2/ϕ1 (left) and velocity difference V2 − V1 (right) for the second kinematic component with respect to the first one. The contours correspond to the intensity levels (1.8 × 10⁻¹⁷, 3.6 × 10⁻¹⁷ erg cm−2 s−1 Å−1) of the flux map of the main component (top left). The black cross symbol representing the M31 optical center, 00h42m44.37s + 41d16m08.34 (Crane et al. 1992).
Current usage metrics show cumulative count of Article Views (full-text article views including HTML views, PDF and ePub downloads, according to the available data) and Abstracts Views on Vision4Press platform.
Data correspond to usage on the plateform after 2015. The current usage metrics is available 48-96 hours after online publication and is updated daily on week days.
Initial download of the metrics may take a while.