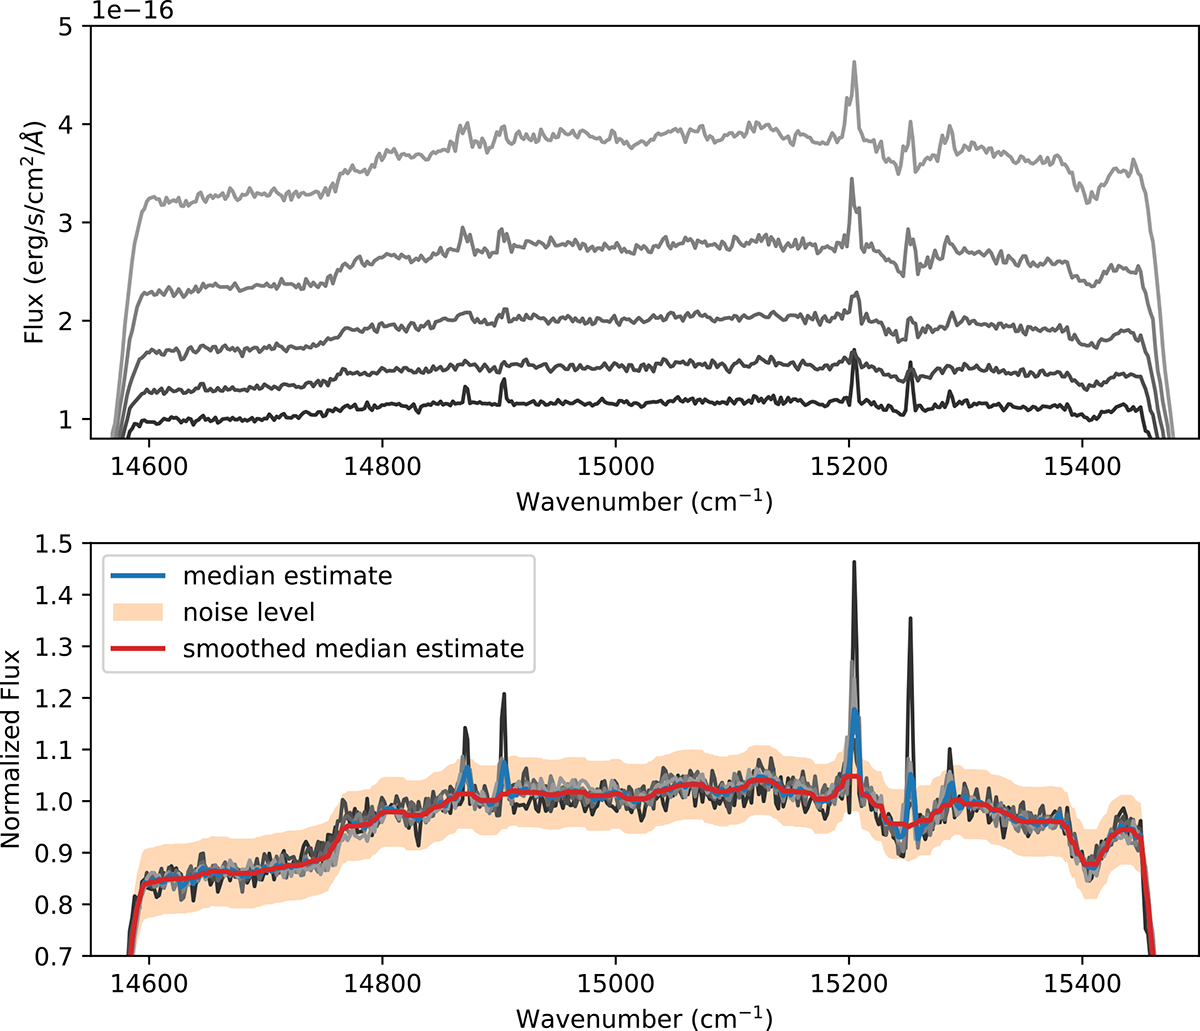
Fig. 3.
Download original image
Example of the old stellar population modeling in a 200 × 200 pixels2 box near the center of the galaxy. Top panel: Random spectra taken in the box to illustrate the strong brightness gradient. Bottom panel: Same spectra after a normalization by their mean flux. The resulting median spectrum of all the normalized spectra contained in the box is shown in blue, the smoothed version used as an estimation of the old stellar population is shown in red. The noise level of the individual 7 × 7 binned spectra used during the fitting procedure is shown as an orange envelope.
Current usage metrics show cumulative count of Article Views (full-text article views including HTML views, PDF and ePub downloads, according to the available data) and Abstracts Views on Vision4Press platform.
Data correspond to usage on the plateform after 2015. The current usage metrics is available 48-96 hours after online publication and is updated daily on week days.
Initial download of the metrics may take a while.