Fig. 2.
Download original image
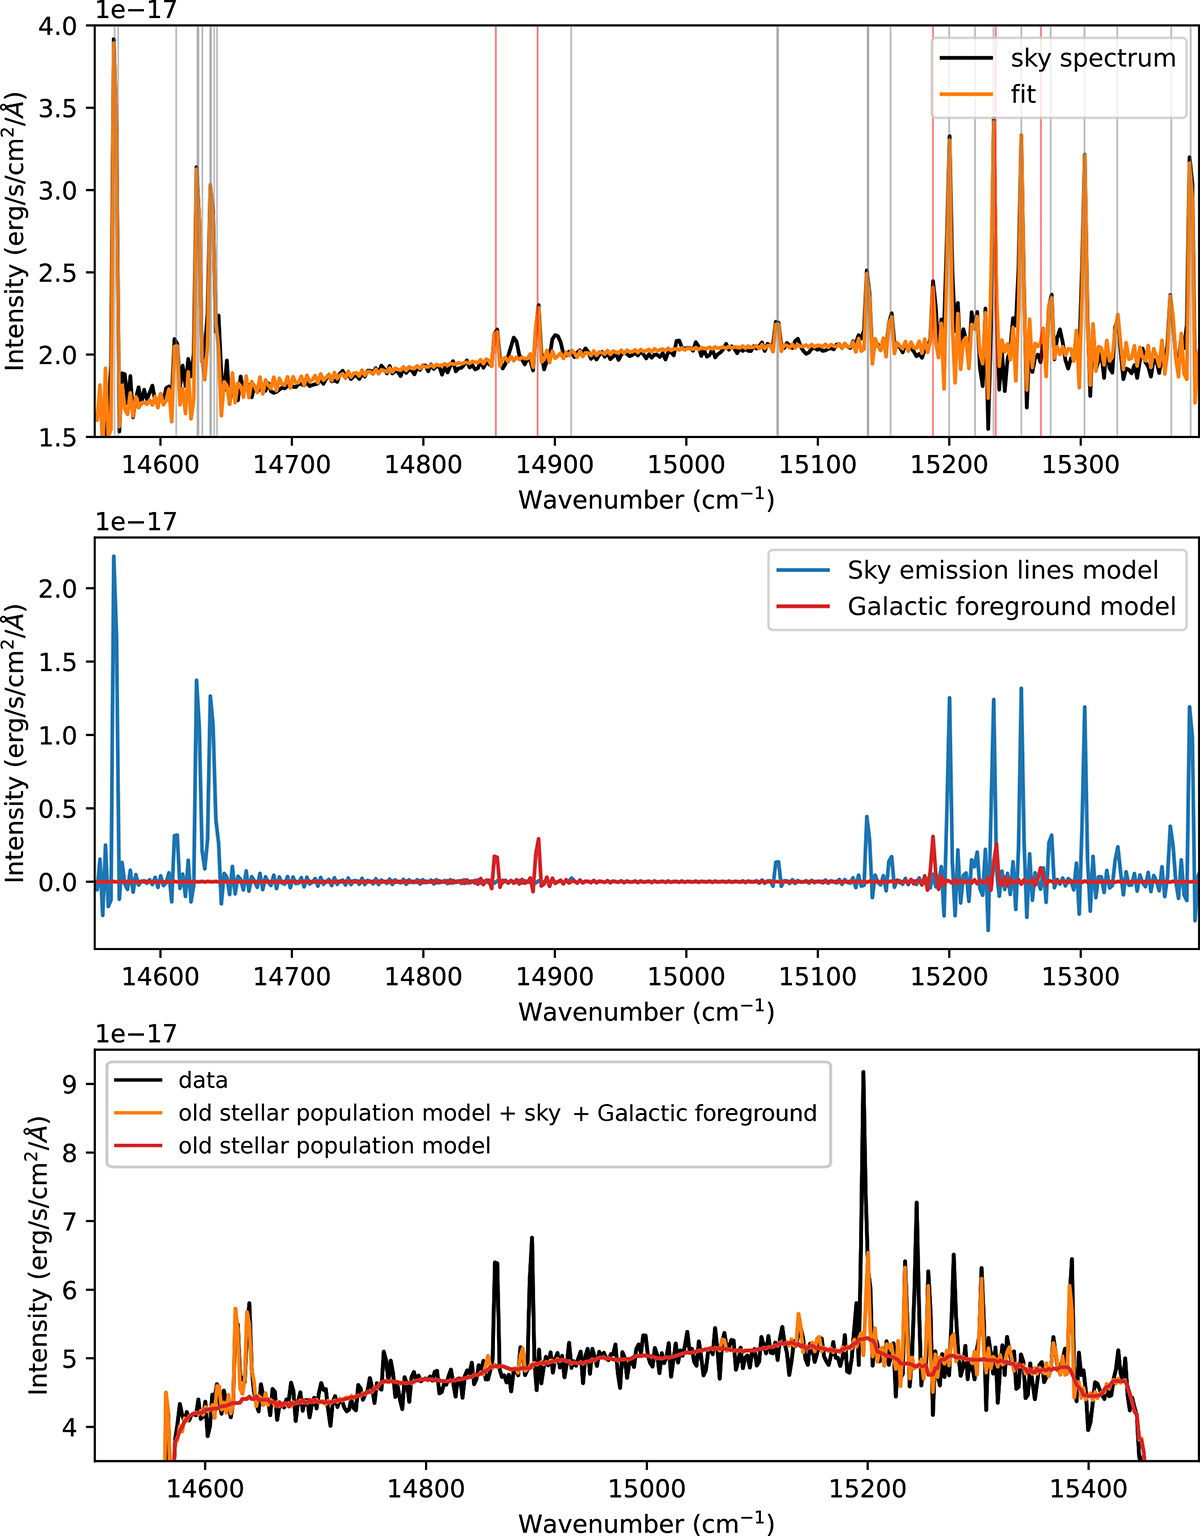
Background subtraction. Top panel: Fit of the sky lines over a low brightness region of the field of view. The vertical gray lines indicate the position of the atmospheric sky lines. The five red vertical lines indicate the position of the foreground emission of the DIG of our own Galaxy in the [N II] (6563, 6584), [S II] (6717, 6731) and Hα lines at a velocity of −38 ± 5 km/s. Middle panel: Sky lines model and Galactic foreground model. During the fitting procedure the velocity of the sky lines and the velocity of the Galactic foreground were two independent parameters. Bottom panel: Analyzed spectrum and model of the background.
Current usage metrics show cumulative count of Article Views (full-text article views including HTML views, PDF and ePub downloads, according to the available data) and Abstracts Views on Vision4Press platform.
Data correspond to usage on the plateform after 2015. The current usage metrics is available 48-96 hours after online publication and is updated daily on week days.
Initial download of the metrics may take a while.