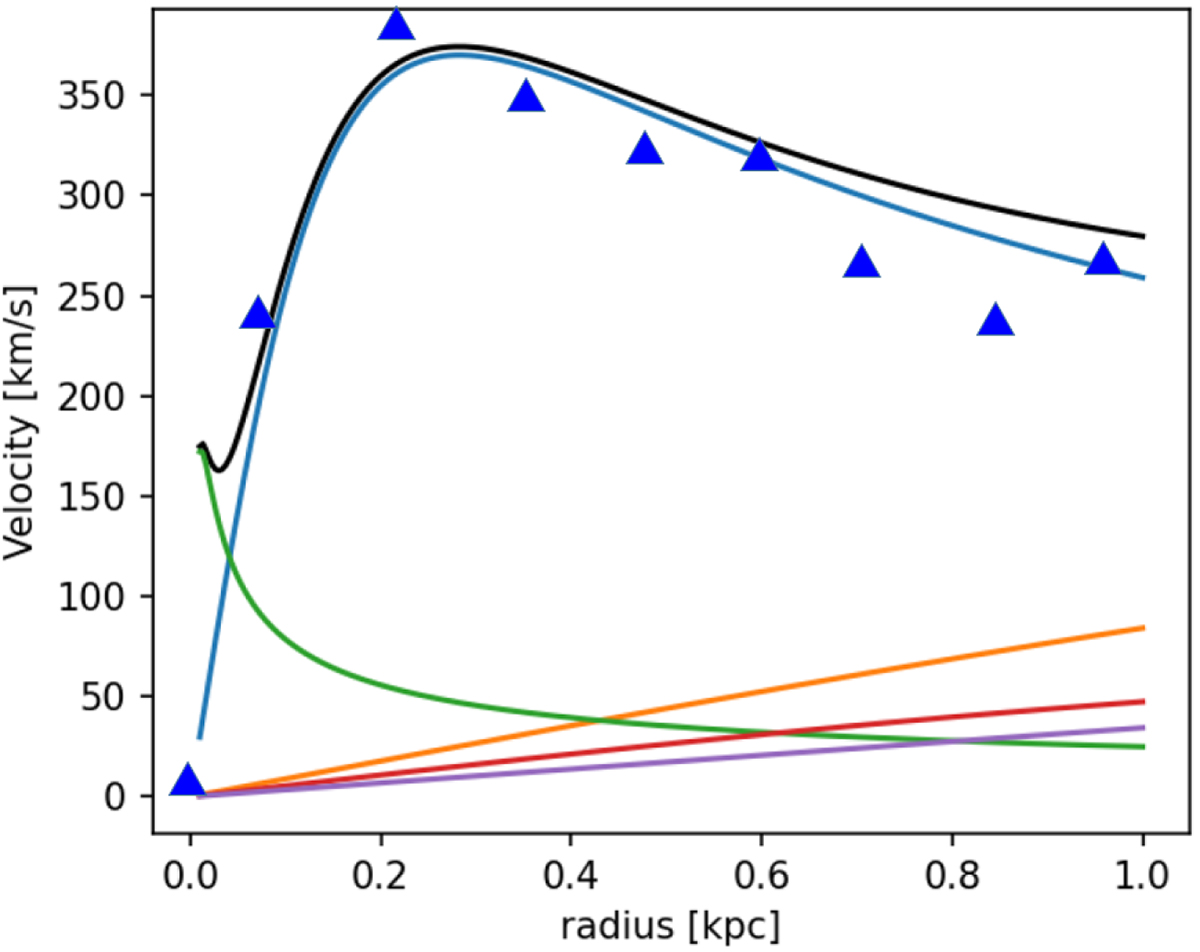
Fig. 19.
Download original image
Theoretical rotation curve derived from Eq. (4), using parameters from Table 1. The contributions are from the nucleus (green), the bulge (blue), the stellar disk (orange), the gaseous disk (red), and the dark matter halo (purple). The black line is the total rotation curve. The blue triangles correspond to the measured ionized gas velocities, averaged over the NE and SW side, and corrected from asymmetric drift.
Current usage metrics show cumulative count of Article Views (full-text article views including HTML views, PDF and ePub downloads, according to the available data) and Abstracts Views on Vision4Press platform.
Data correspond to usage on the plateform after 2015. The current usage metrics is available 48-96 hours after online publication and is updated daily on week days.
Initial download of the metrics may take a while.