Fig. 12.
Download original image
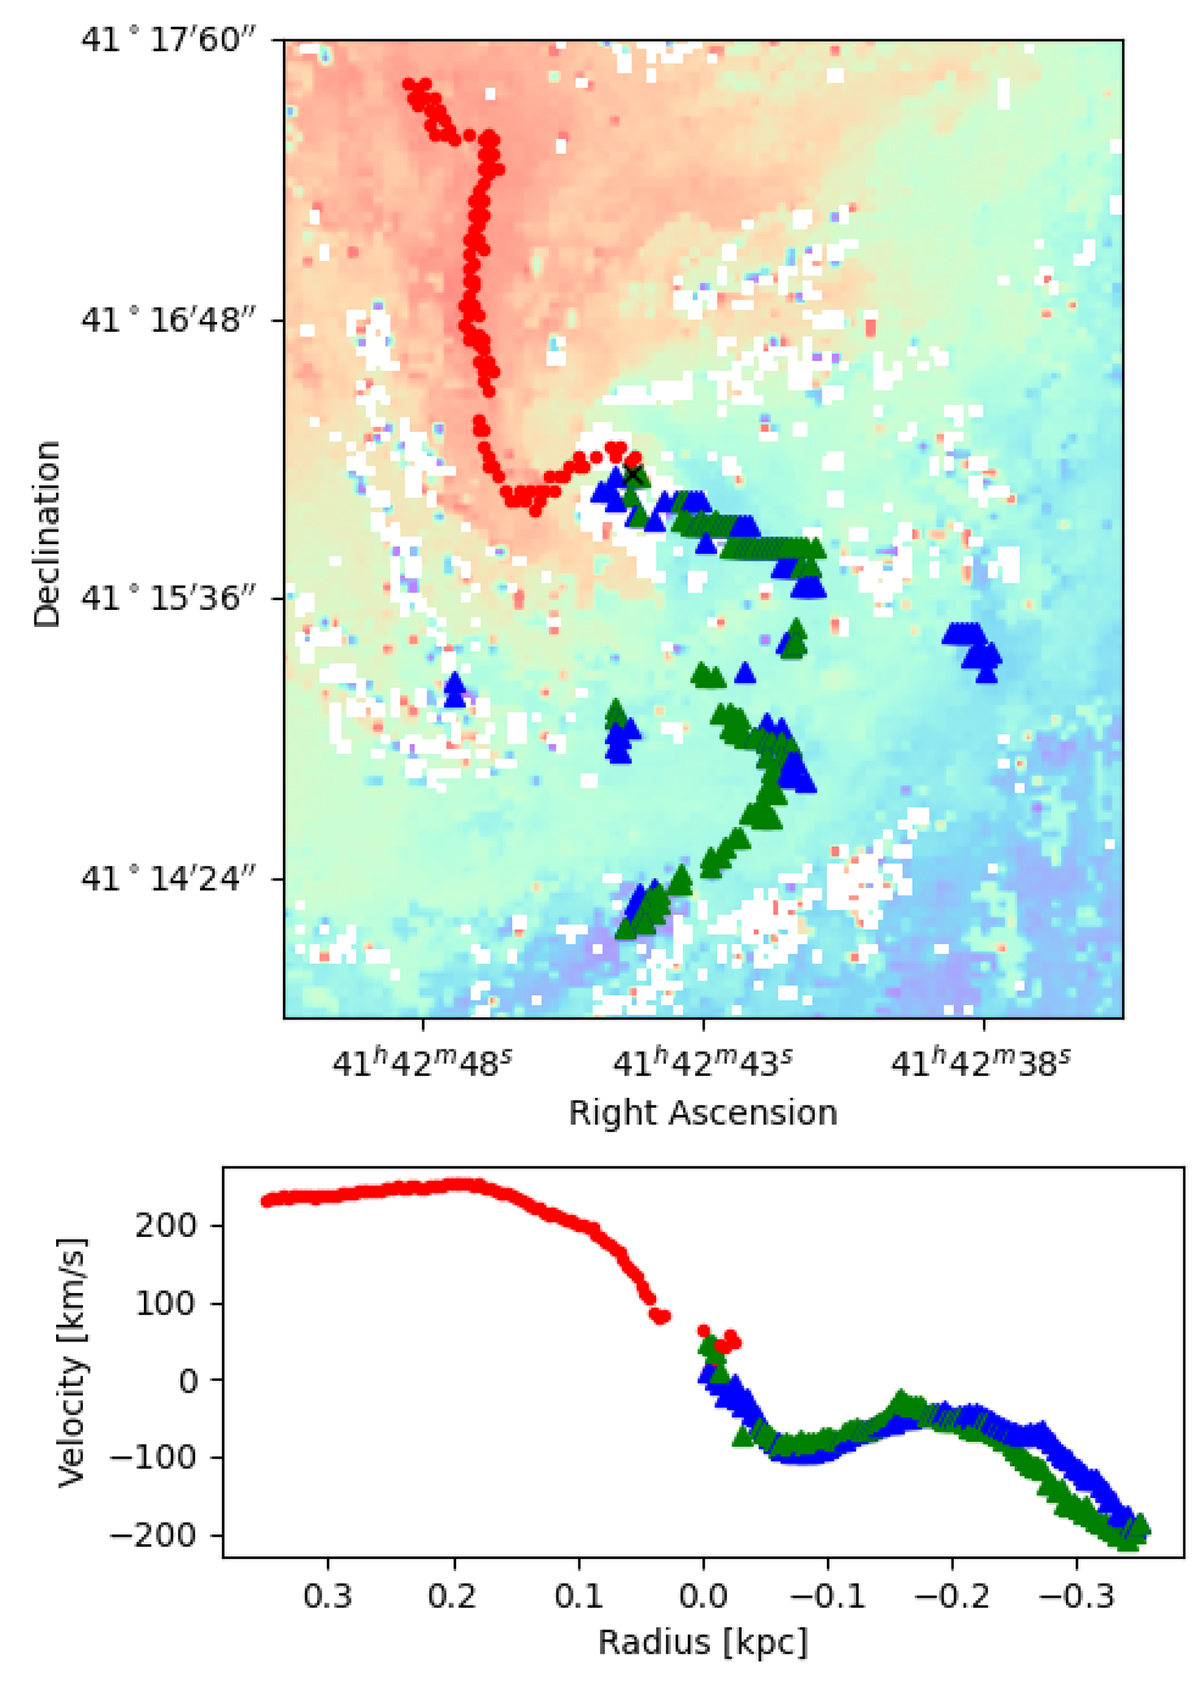
Zoom-in on the winding in the very center of the map. The analysis is conducted on N = 100 radii from Rmin = 0 to Rmax = 0.35 kpc. Top panel: Vmin (blue), ![]() , and Vmax velocities superposed on the kinematic map, together with the maximal velocity (red bullets), minimal velocity (blue triangle) and minimal velocity of the second component (green triangle), for each radii. Bottom panel: Corresponding velocity values as a function of the galactocentric radius. The negative radii correspond to the distance of the points in the southwest region.
, and Vmax velocities superposed on the kinematic map, together with the maximal velocity (red bullets), minimal velocity (blue triangle) and minimal velocity of the second component (green triangle), for each radii. Bottom panel: Corresponding velocity values as a function of the galactocentric radius. The negative radii correspond to the distance of the points in the southwest region.
Current usage metrics show cumulative count of Article Views (full-text article views including HTML views, PDF and ePub downloads, according to the available data) and Abstracts Views on Vision4Press platform.
Data correspond to usage on the plateform after 2015. The current usage metrics is available 48-96 hours after online publication and is updated daily on week days.
Initial download of the metrics may take a while.