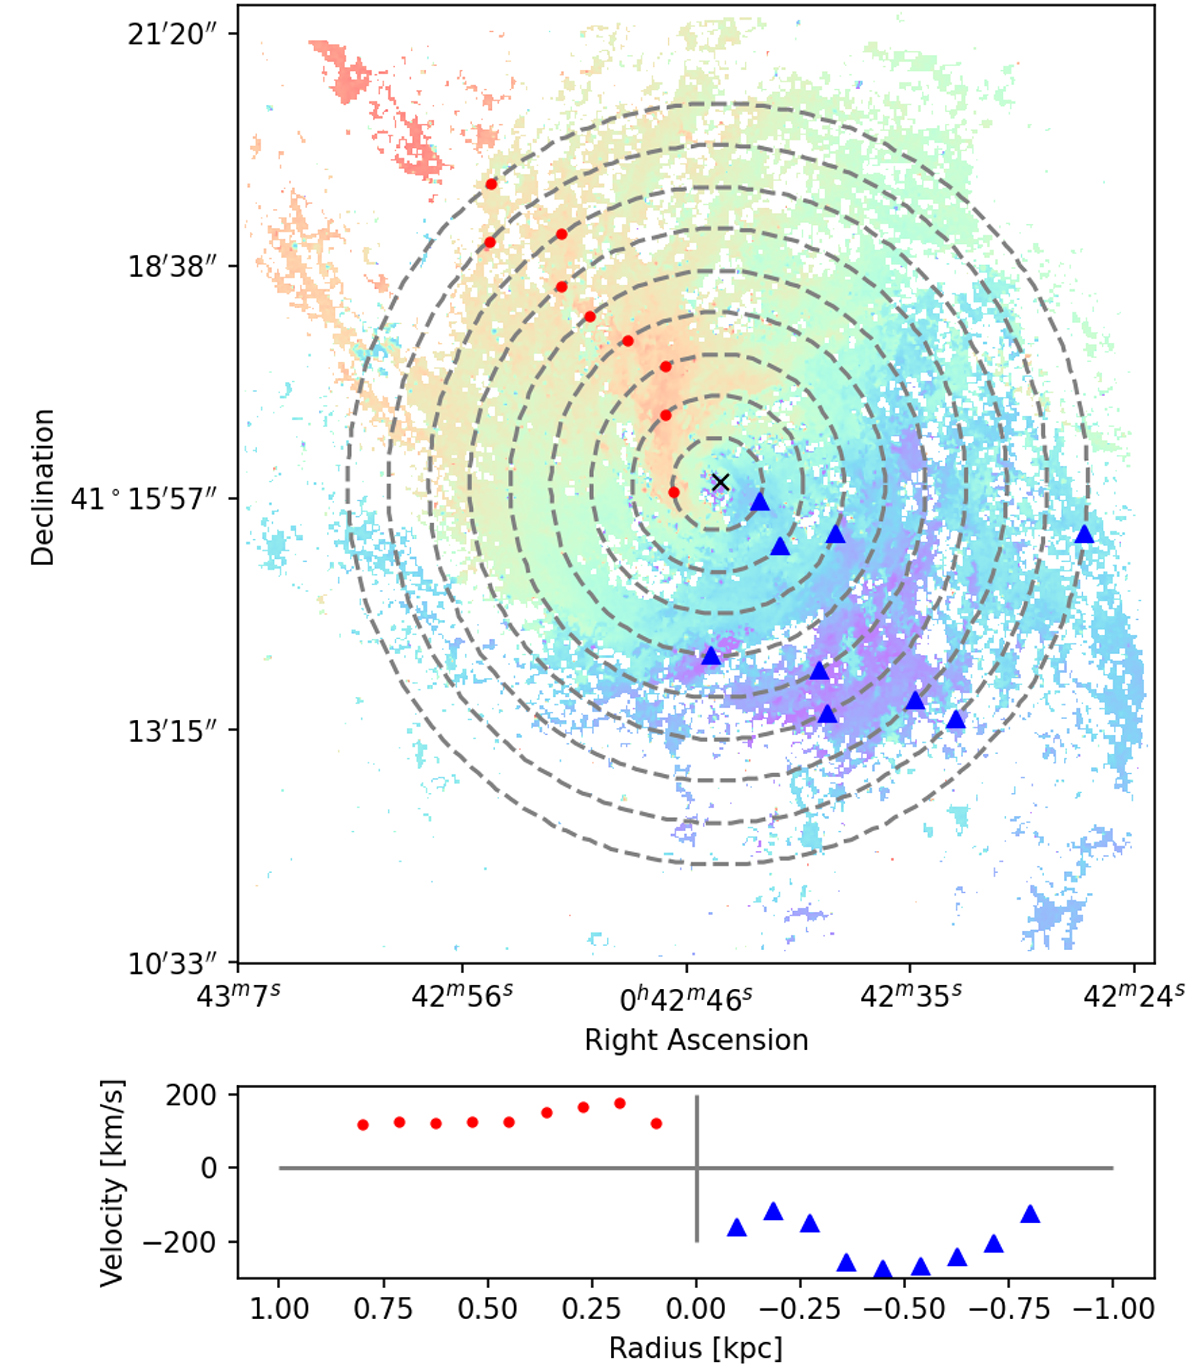
Fig. 10.
Download original image
Simplified illustration of the map processing, on N = 9 concentric circles, with radii regularly spaced between Rmin = 0 and Rmax = 0.8 kpc. Top panel: Velocity map overlaid by the concentric circles (in gray dotted lines). The red dots (resp. blue triangles) are the maximal (resp. minimal) values Vmax (resp. Vmin) for each circle, and have been computed with n = 7. Bottom panel: Previous extrema Vmax and Vmin of the velocity displayed as a function of the distance from the center (i.e., the radius of its corresponding circle). The negative distances corresponds to the blue shifted part of the map, where the velocities are negative. The gray lines represent the origin axes.
Current usage metrics show cumulative count of Article Views (full-text article views including HTML views, PDF and ePub downloads, according to the available data) and Abstracts Views on Vision4Press platform.
Data correspond to usage on the plateform after 2015. The current usage metrics is available 48-96 hours after online publication and is updated daily on week days.
Initial download of the metrics may take a while.