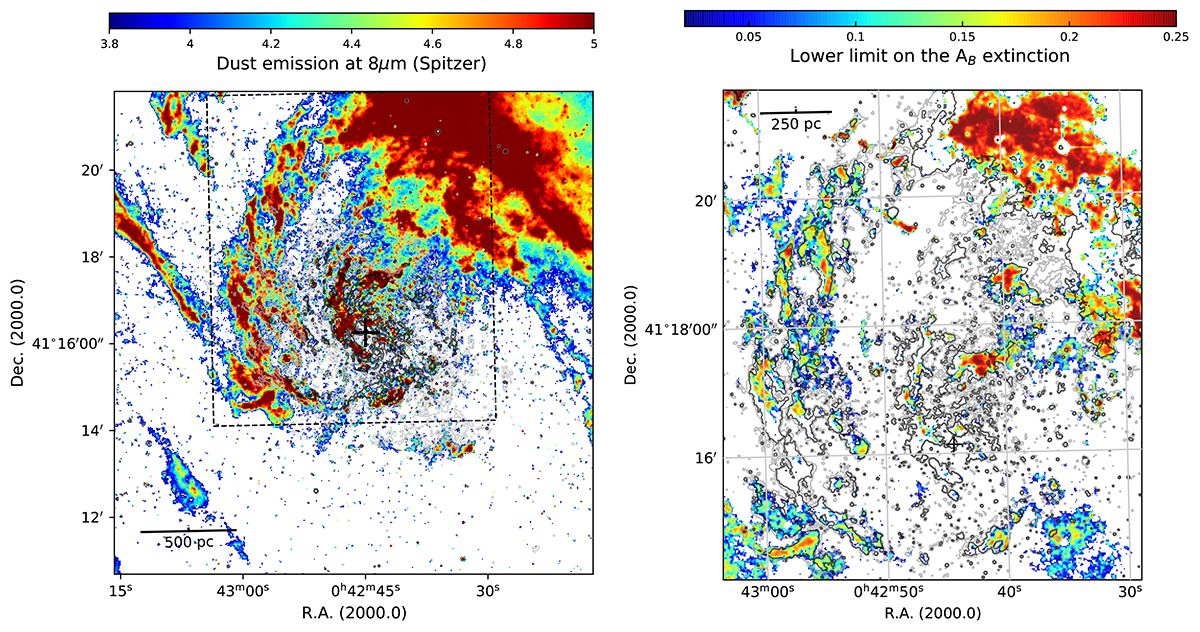
Fig. 1.
Download original image
Dust location in the central kpc field of view of Andromeda. Left panel: Dust emission map obtained from the 8 μm Spitzer map with a subtraction of the stellar continuum at 3.6 μm. (Block et al. 2006). The contours correspond to the ionized gas intensity displayed in the top left panel of Fig. 5. The dashed square corresponds to the inner ring region displayed in the right panel. Right panel: an upper limit estimate on the AB extinction (Melchior et al. 2000). The gray contours correspond to the dust emission at 8 μm displayed in the left panel. The black cross symbol represents the M31 center.
Current usage metrics show cumulative count of Article Views (full-text article views including HTML views, PDF and ePub downloads, according to the available data) and Abstracts Views on Vision4Press platform.
Data correspond to usage on the plateform after 2015. The current usage metrics is available 48-96 hours after online publication and is updated daily on week days.
Initial download of the metrics may take a while.