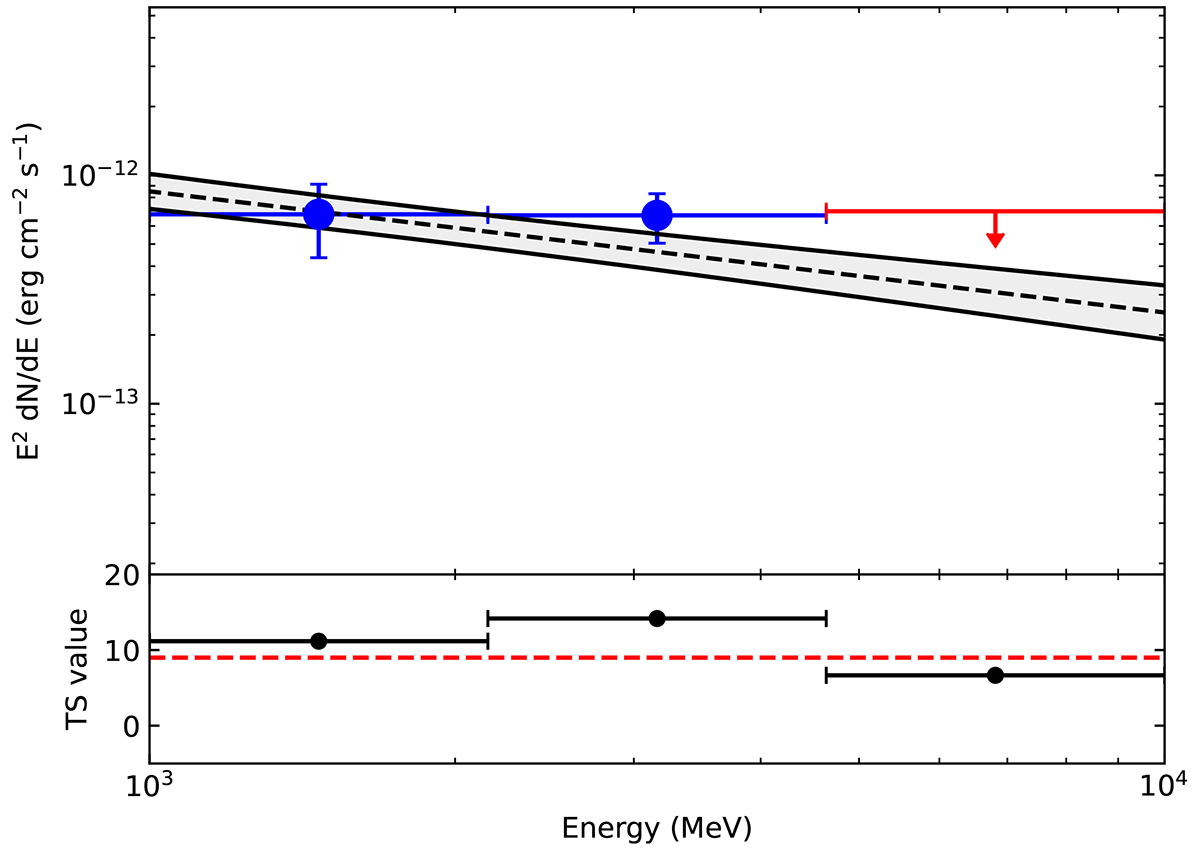
Fig. 5.
Download original image
SED with three equally spaced logarithmic energy bins, extracted in the 1–10 GeV energy range. The blue data points represent detections above a 3σ c.l., while the red arrow represents an upper limit. The dashed red line in the bottom panel corresponds to TS = 9, meaning a 3σ detection level. The source is well-modelled with a power law with photon index Γ = 2.5, here represented by the dashed black line. The two solid black lines represent the 1σ bounds with respect to the model.
Current usage metrics show cumulative count of Article Views (full-text article views including HTML views, PDF and ePub downloads, according to the available data) and Abstracts Views on Vision4Press platform.
Data correspond to usage on the plateform after 2015. The current usage metrics is available 48-96 hours after online publication and is updated daily on week days.
Initial download of the metrics may take a while.