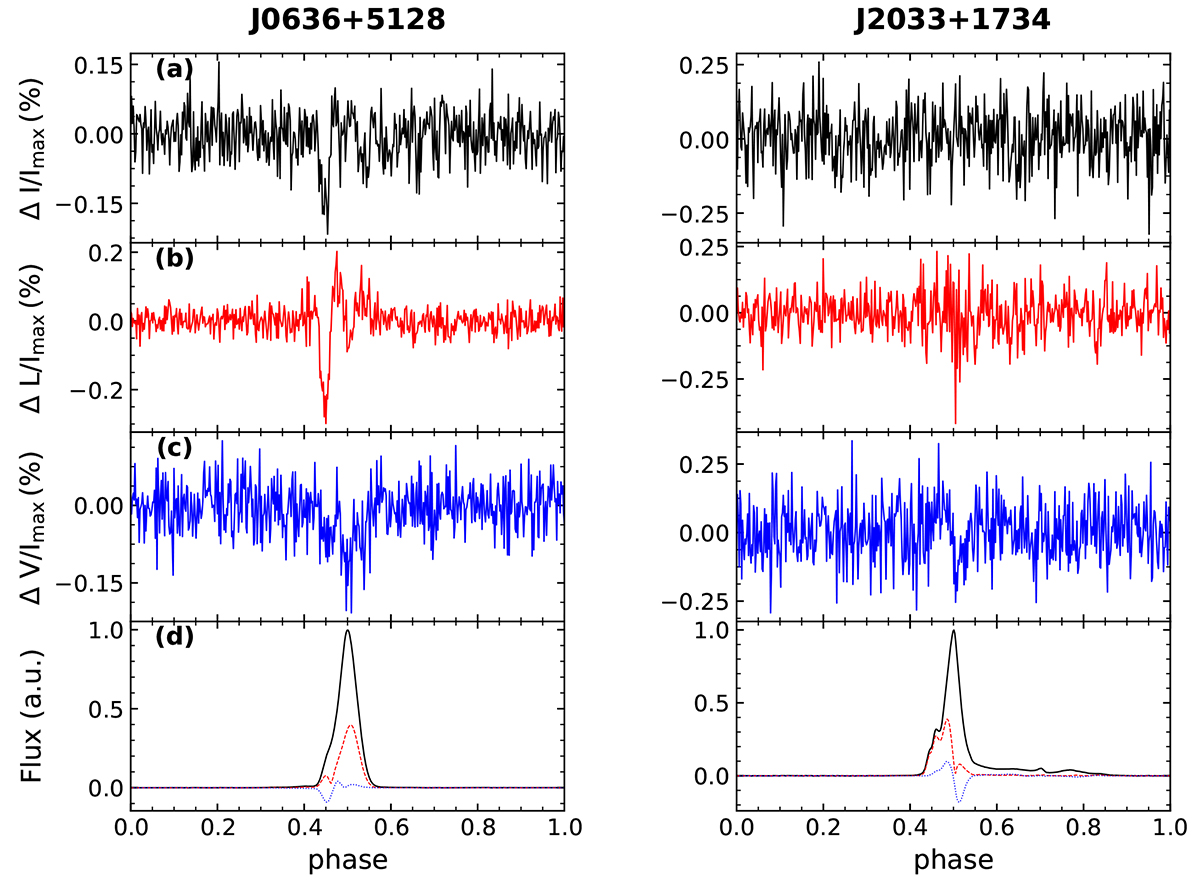
Fig. A.1.
Download original image
Polarization profile differences between small and large zenith angle observations for PSRs J0636+5128 and J2033+1734, which contain enough number of observations. Panel (a), (b), (c) are the profile residuals for total intensity, linear and circular polarization, respectively. Panel (d) is the polarization profile from small zenith angle observations. The black, red, and blue represents total intensity, linear, and circular polarization, respectively. We normalize all the curves, such that the peak total intensity is 1.
Current usage metrics show cumulative count of Article Views (full-text article views including HTML views, PDF and ePub downloads, according to the available data) and Abstracts Views on Vision4Press platform.
Data correspond to usage on the plateform after 2015. The current usage metrics is available 48-96 hours after online publication and is updated daily on week days.
Initial download of the metrics may take a while.