Open Access
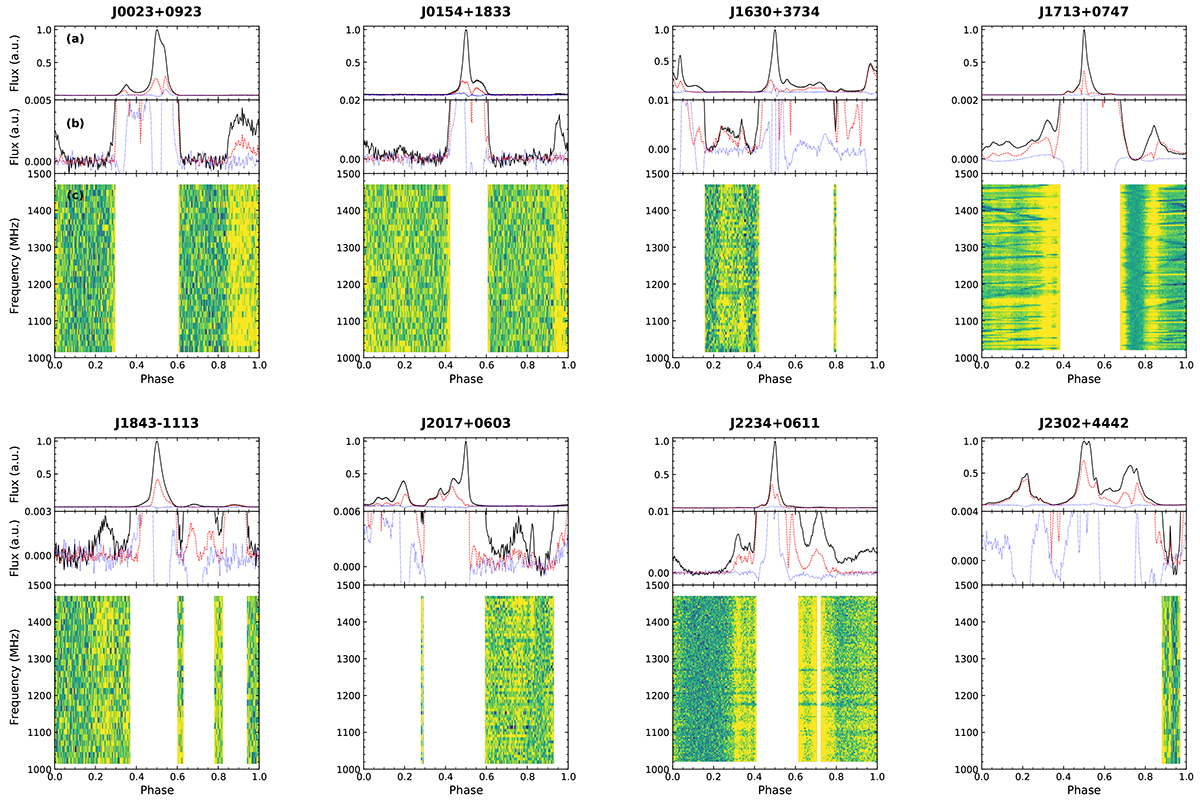
Fig. 6.
Download original image
Dynamic spectra of weak components for eight CPTA MSPs. Panel (a) shows the full polarization profile, panel (b) zooms into the low-flux region to show the weak radiation or weak components, and panel (c) shows the dynamic spectra, where total fluxes larger than the range displayed in panel (b) are masked out (in white).
Current usage metrics show cumulative count of Article Views (full-text article views including HTML views, PDF and ePub downloads, according to the available data) and Abstracts Views on Vision4Press platform.
Data correspond to usage on the plateform after 2015. The current usage metrics is available 48-96 hours after online publication and is updated daily on week days.
Initial download of the metrics may take a while.