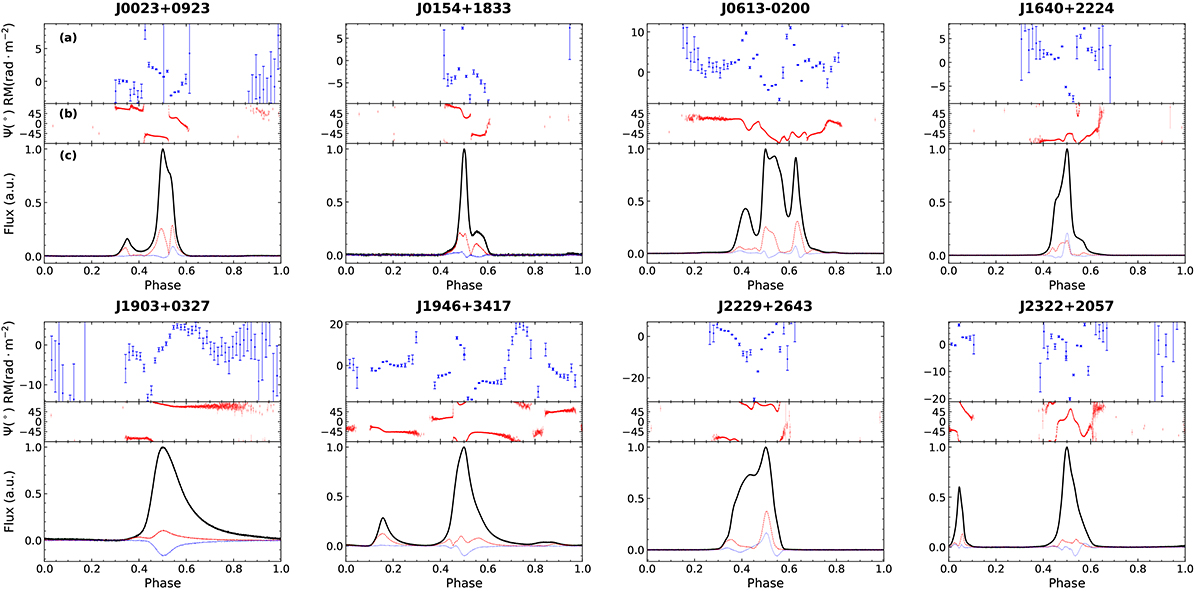
Fig. 3.
Download original image
Apparent RM variations along pulse phase detected for eight pulsars. Panel (a) displays the RM variations after subtracting the average RM value. Panel (b) PA curves. Panel (c) polarization pulse profiles, where solid black, dashed red, and dotted blue curves denote the total intensity, linear intensity, and circular polarization intensity, respectively. The profiles were normalized by the maximal intensity and the phase of the intensity peak was set at 0.5.
Current usage metrics show cumulative count of Article Views (full-text article views including HTML views, PDF and ePub downloads, according to the available data) and Abstracts Views on Vision4Press platform.
Data correspond to usage on the plateform after 2015. The current usage metrics is available 48-96 hours after online publication and is updated daily on week days.
Initial download of the metrics may take a while.