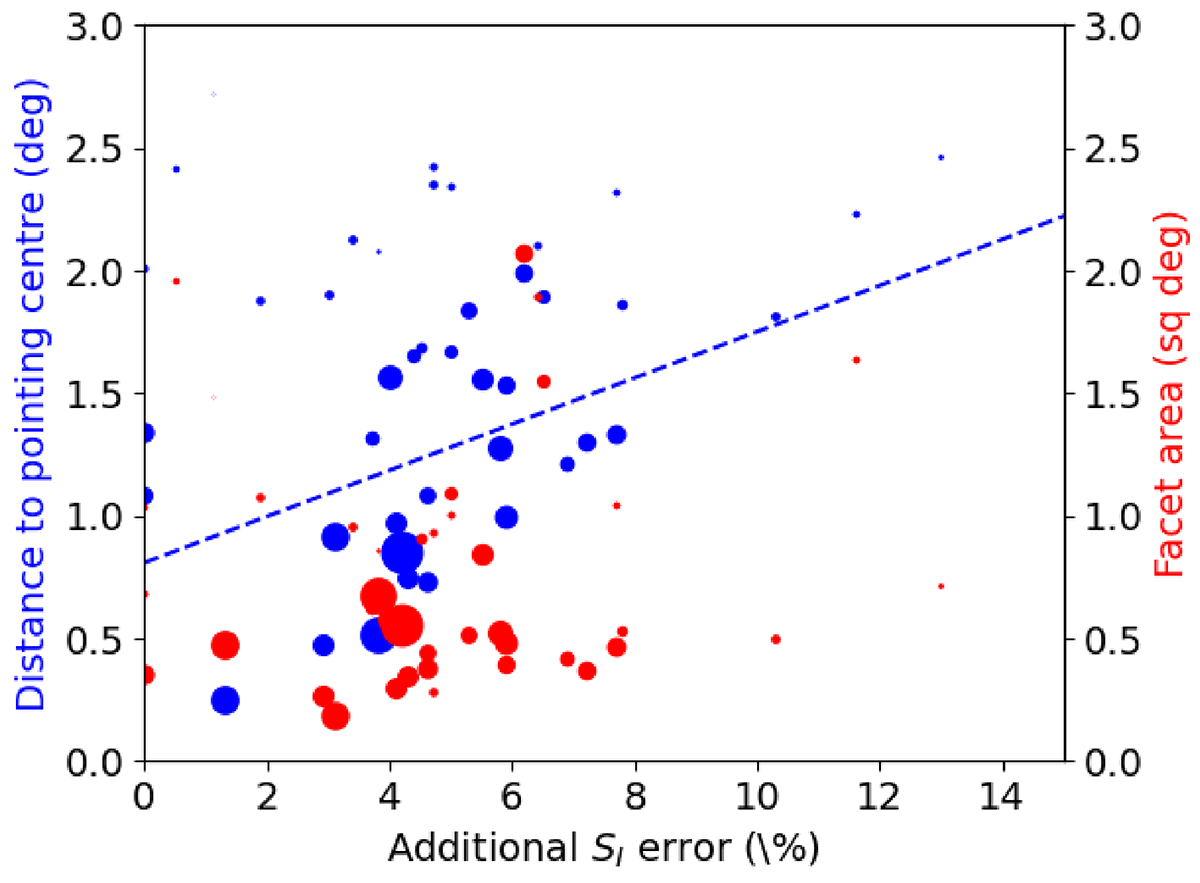
Fig. 9.
Download original image
Additional fractional uncertainty in SI for each facet plotted against distance to the pointing centre (blue) and the facet area (red). The additional uncertainty is derived by comparing the distribution of ratios of integrated flux density measurements in each epoch to the deep integration for the 1447 sources detected in the 58 good epochs with a simple simulation using the same sources and errors but allowing for flux density scale offsets between pointings and facets. The consistency of our epoch image integrated flux density measurements decreases with increasing distance from the facet centre and the dashed blue line shows a linear fit to the data using the number of sources in the facet (proportional to marker size) for weighting.
Current usage metrics show cumulative count of Article Views (full-text article views including HTML views, PDF and ePub downloads, according to the available data) and Abstracts Views on Vision4Press platform.
Data correspond to usage on the plateform after 2015. The current usage metrics is available 48-96 hours after online publication and is updated daily on week days.
Initial download of the metrics may take a while.