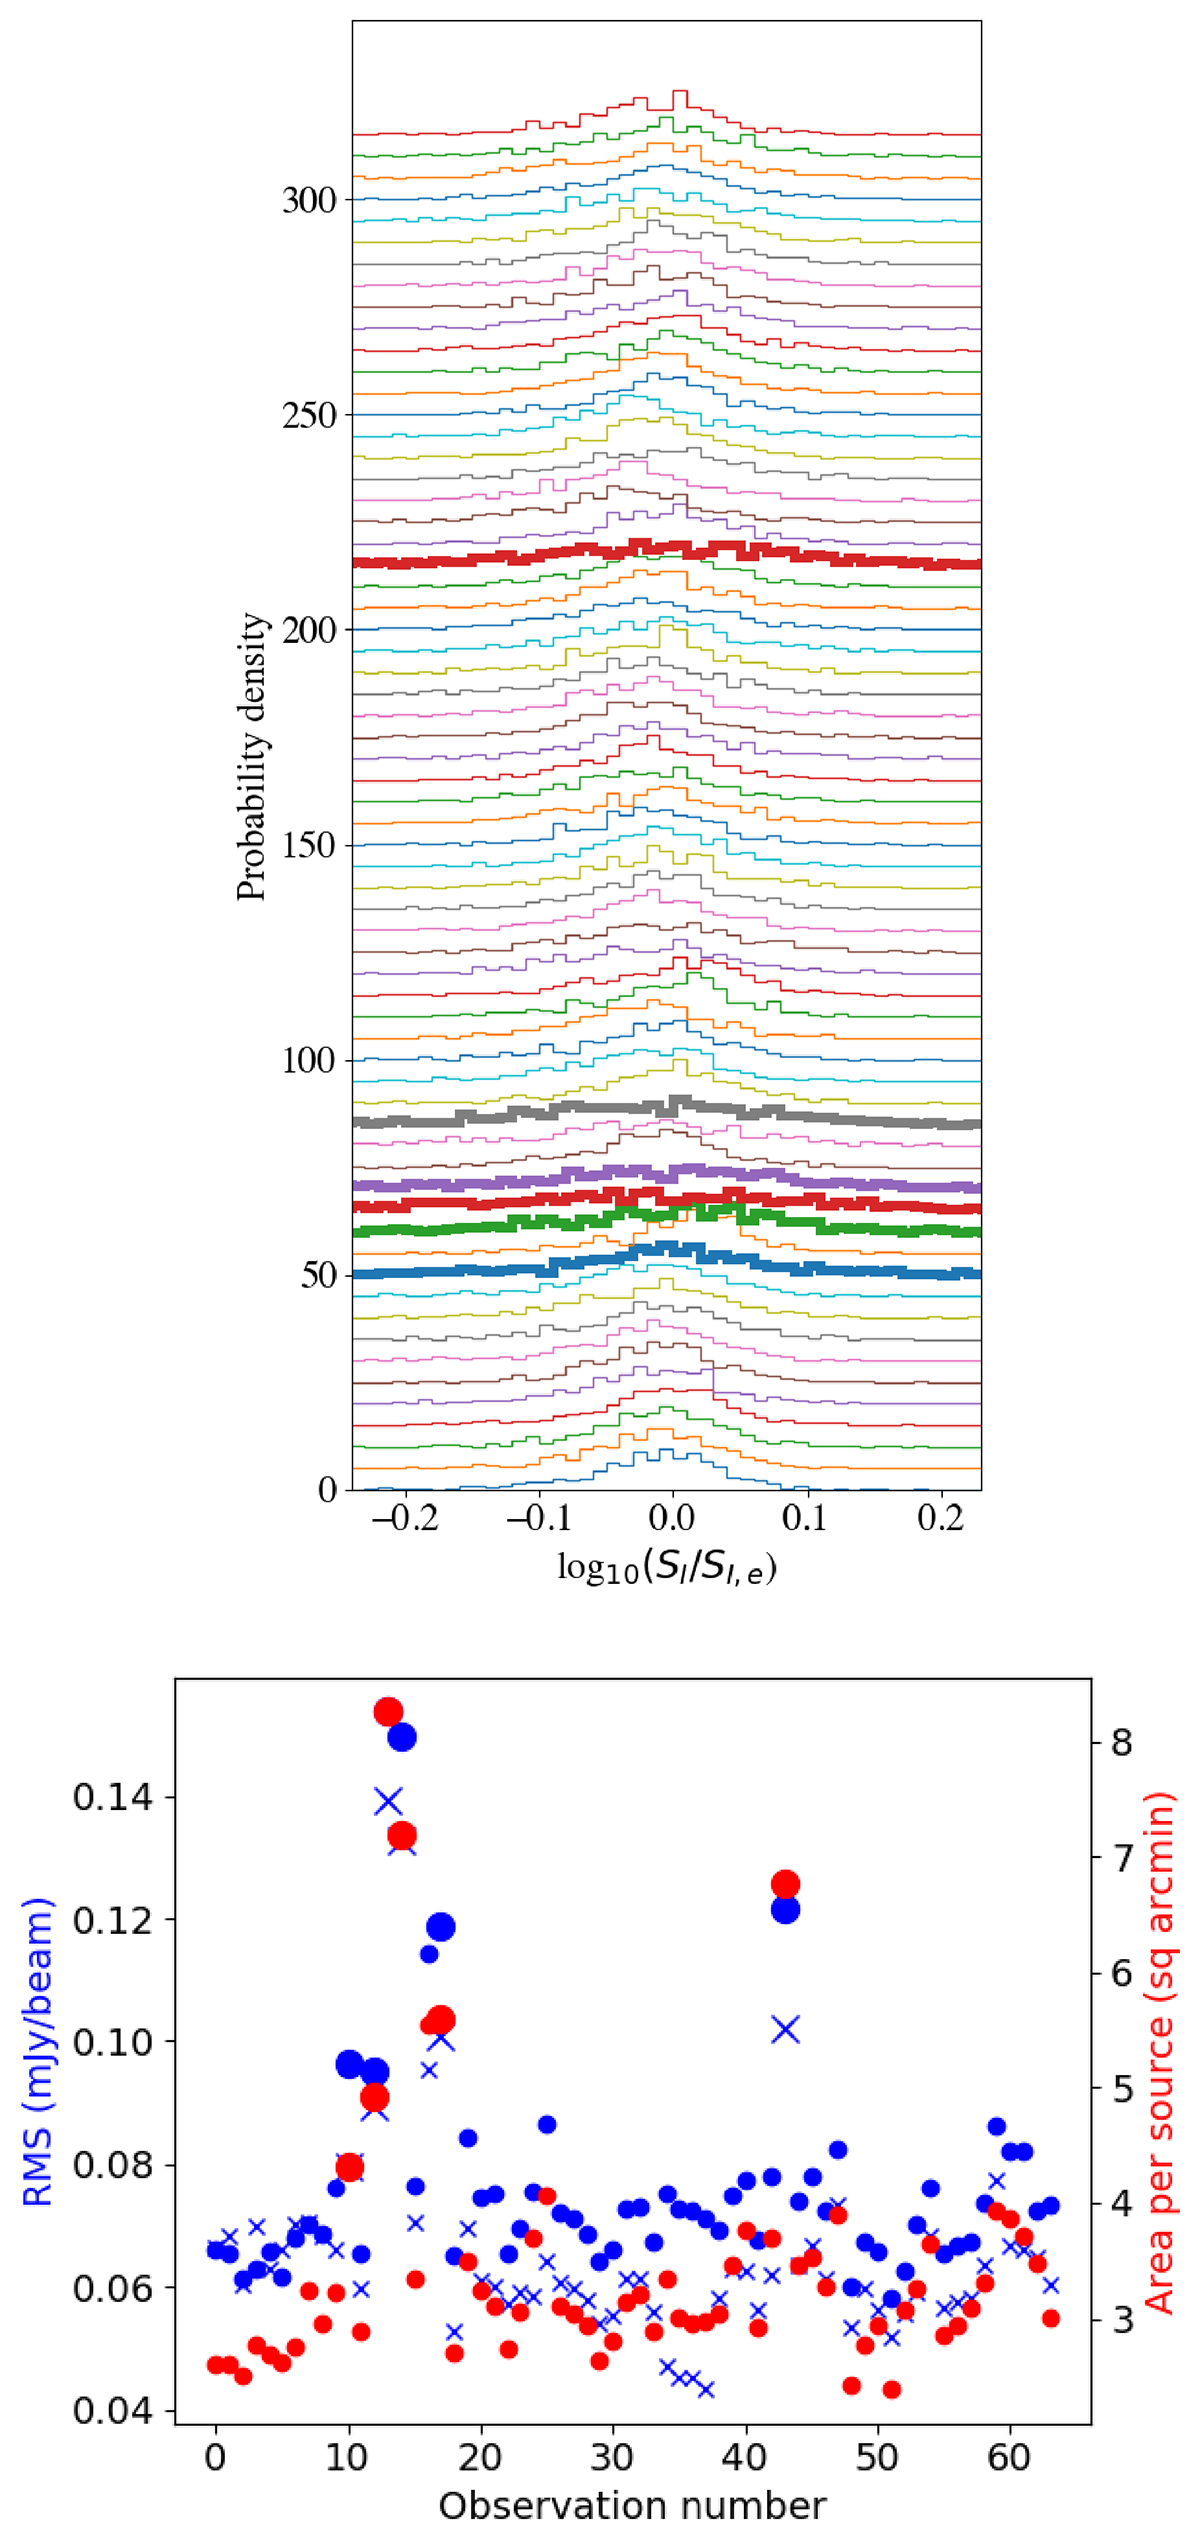
Fig. 8.
Download original image
Variations in the characteristics of the individual epoch ELAIS-N1 images. The top panel shows the probability density histograms of the integrated flux density ratio for the 64 individual epochs catalogues compared to measurements from our final continuum image. The y-axis of each epoch is offset by five for display purposes. The six thick lines correspond to observations L233804, L346136, L346154, L346454, L347494, and L782679, which have poor flux density values and were identified as having either a median flux density ratio or standard deviation further than 1.5 sigma from the other observations. In the bottom panel we show the RMS measured for each of the 64 epochs with blue circles and the blue crosses show the RMS scaled to a consistent 90° elevation, 231 subbands and 8 h duration without any flagging (see Table S1). The red circles show the area per detected source in each of the epoch images (i.e. inverse of source density). The larger circles and crosses correspond to the six poor quality observations.
Current usage metrics show cumulative count of Article Views (full-text article views including HTML views, PDF and ePub downloads, according to the available data) and Abstracts Views on Vision4Press platform.
Data correspond to usage on the plateform after 2015. The current usage metrics is available 48-96 hours after online publication and is updated daily on week days.
Initial download of the metrics may take a while.