Fig. 7.
Download original image
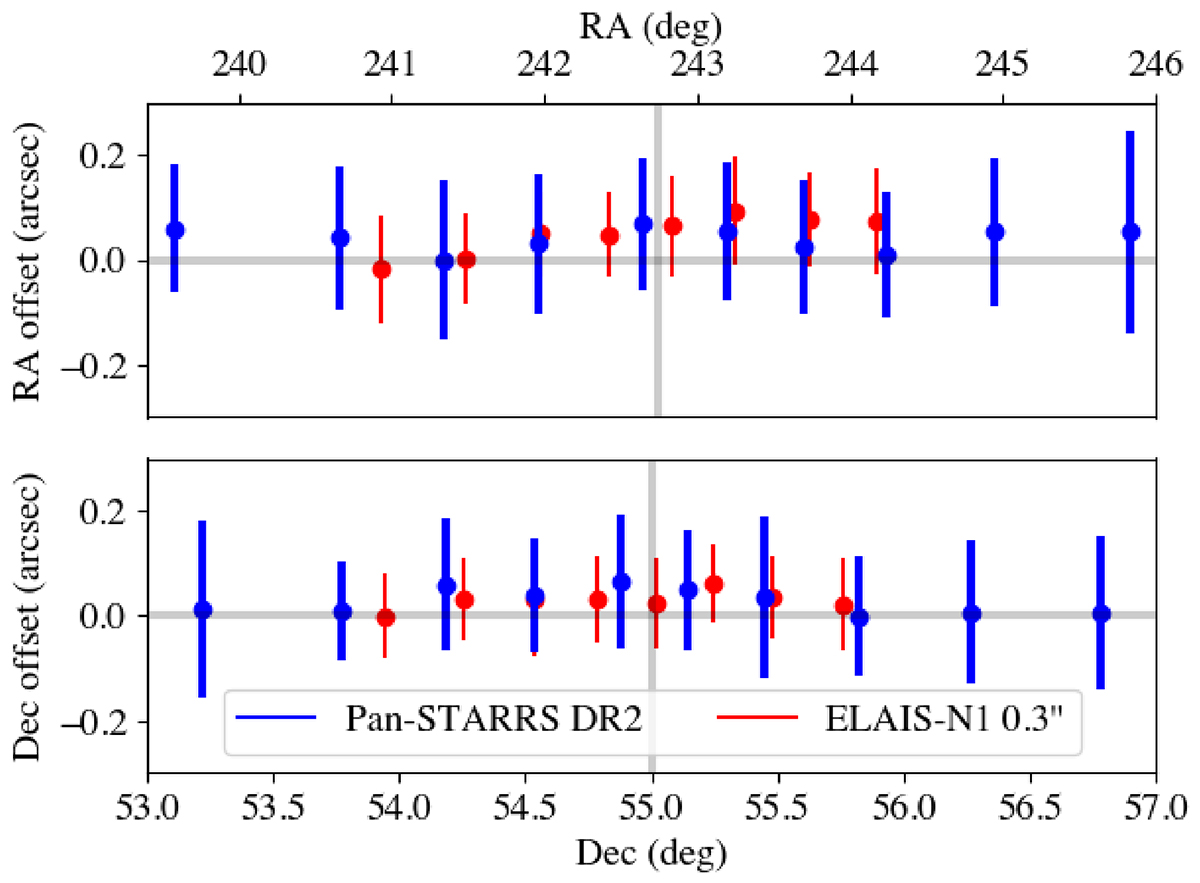
Right ascension and Dec offsets between our catalogued positions and Pan-STARRS DR2 (thick blue) and the ELAIS-N1 0.3″ image (red) from de Jong et al. (2024) as a function of RA and Dec respectively. The error bars show ± the standard deviation of a Gaussian fitted to histograms of the offsets and the points show the centre of the fitted Gaussian. The grey vertical line shows the field centre and the grey horizontal line shows 0 offset.
Current usage metrics show cumulative count of Article Views (full-text article views including HTML views, PDF and ePub downloads, according to the available data) and Abstracts Views on Vision4Press platform.
Data correspond to usage on the plateform after 2015. The current usage metrics is available 48-96 hours after online publication and is updated daily on week days.
Initial download of the metrics may take a while.