Fig. 6.
Download original image
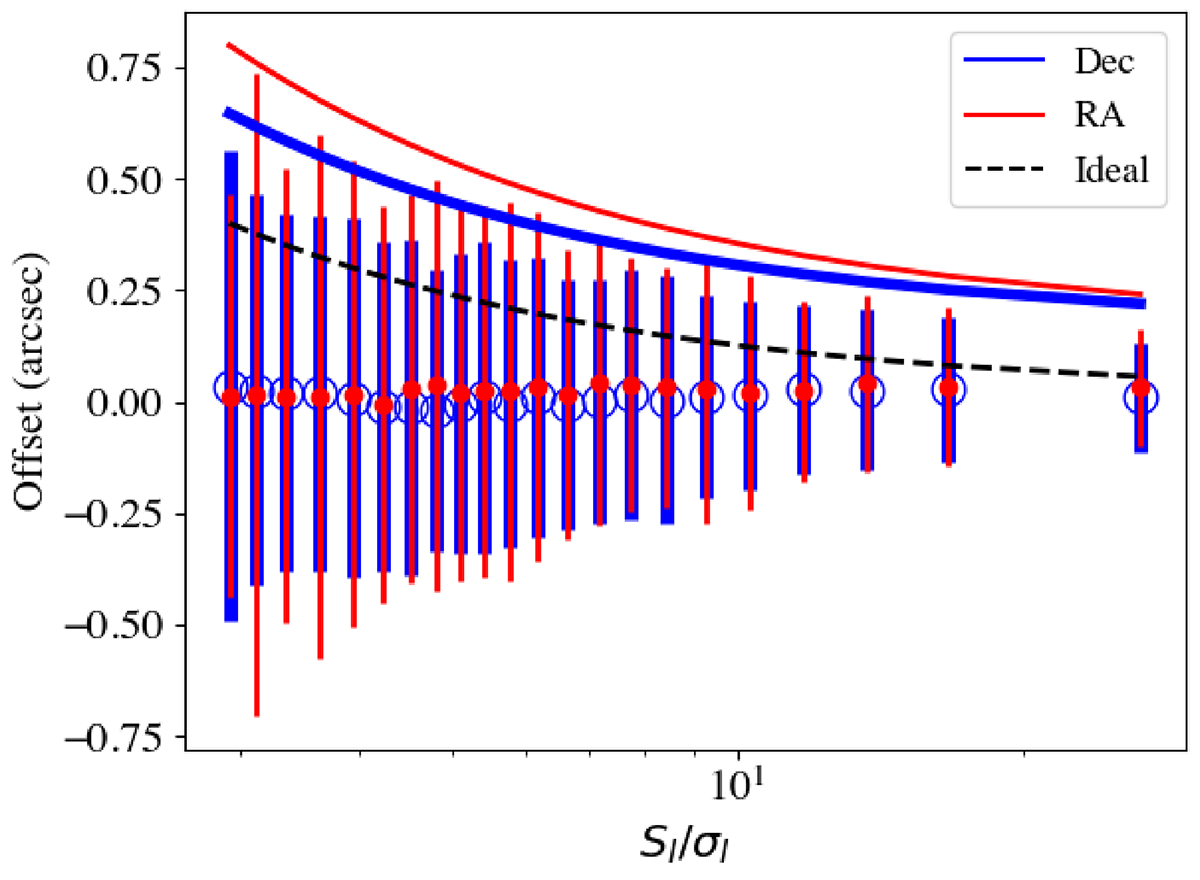
Right ascension (red) and Dec (thick blue) astrometric offsets as a function of SI/σSI. Each flux density bin was chosen to contain 1000 sources and the histograms of the distribution of RA or Dec offsets between our catalogue and Pan-STARRS DR2 were fit with a Gaussian function. The points and error bars show the centre of the fit and ± the standard deviation respectively. Curves fitting the derived standard deviations of RA and Dec as a function of SI/σSI are also shown with the same colour scheme. The black dashed curve shows the behaviour observed through a simple simulation of perfectly compact sources injected into our residual image and characterised with PYBDSF.
Current usage metrics show cumulative count of Article Views (full-text article views including HTML views, PDF and ePub downloads, according to the available data) and Abstracts Views on Vision4Press platform.
Data correspond to usage on the plateform after 2015. The current usage metrics is available 48-96 hours after online publication and is updated daily on week days.
Initial download of the metrics may take a while.