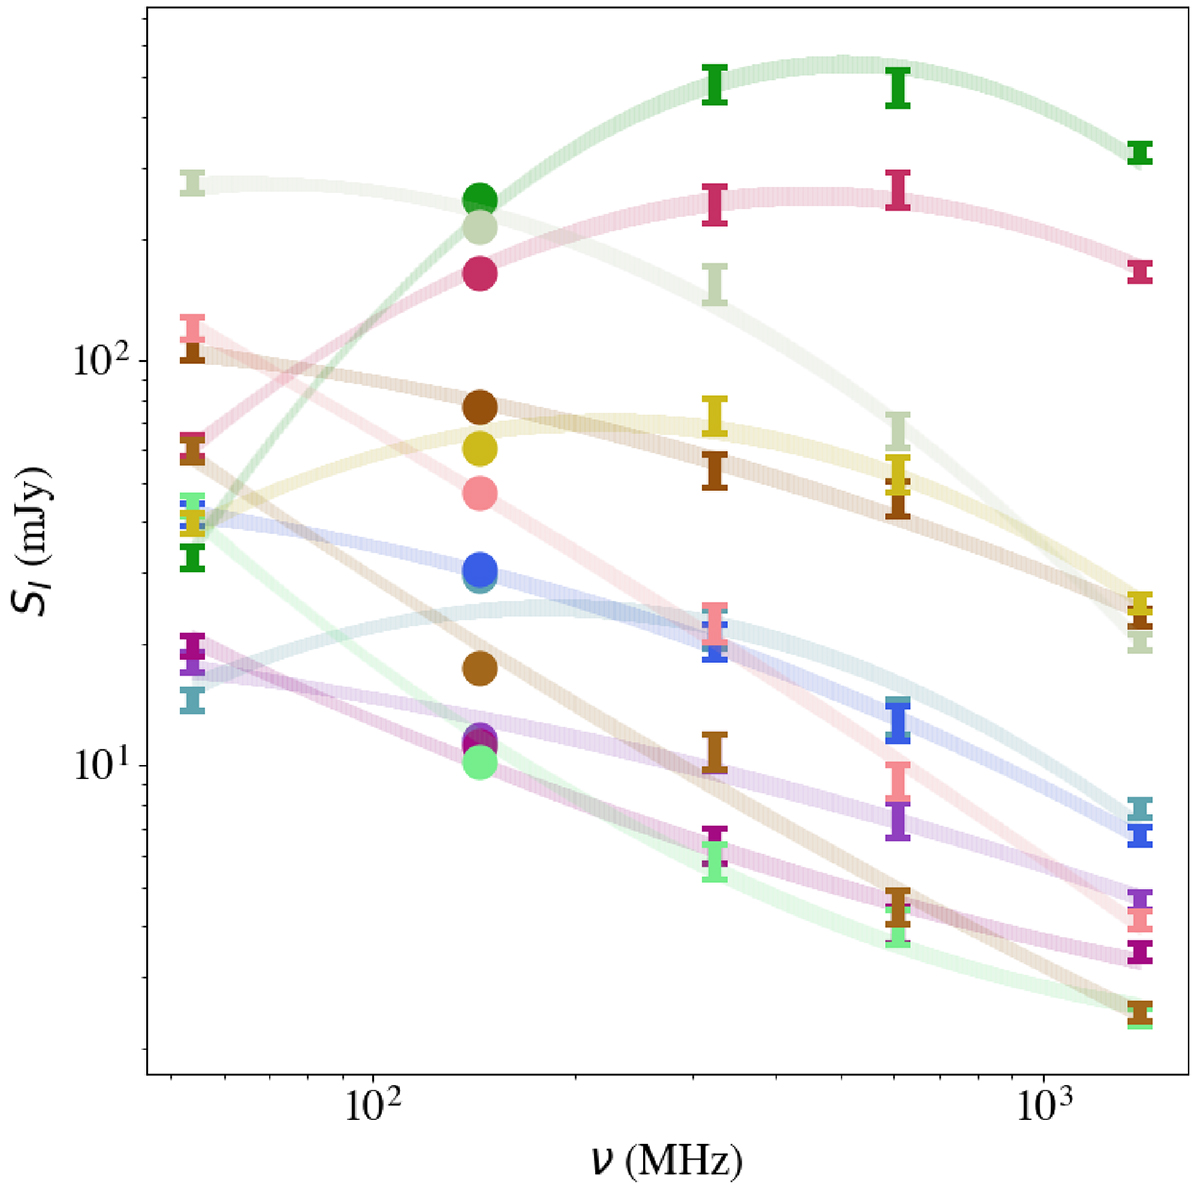
Fig. 5.
Download original image
Selection of 12 of the 55 sources used to verify the deep ELAIS-N1 flux density. Each source is shown in a different colour. The circles show the LoTSS Deep measurements, and the error bars show the LoLSS, GMRT 325 MHz, GMRT 610 MHz, and FIRST measurements with the associated error in the flux density scale. The lines show the derived second-order polynomial fits: log SI(ν) = log S0 + Alog(ν/ν0)+Blog(ν/ν0)2, where S0, A and B are the best-fit parameters. The line thickness shows the uncertainty in the fit.
Current usage metrics show cumulative count of Article Views (full-text article views including HTML views, PDF and ePub downloads, according to the available data) and Abstracts Views on Vision4Press platform.
Data correspond to usage on the plateform after 2015. The current usage metrics is available 48-96 hours after online publication and is updated daily on week days.
Initial download of the metrics may take a while.