Fig. 4.
Download original image
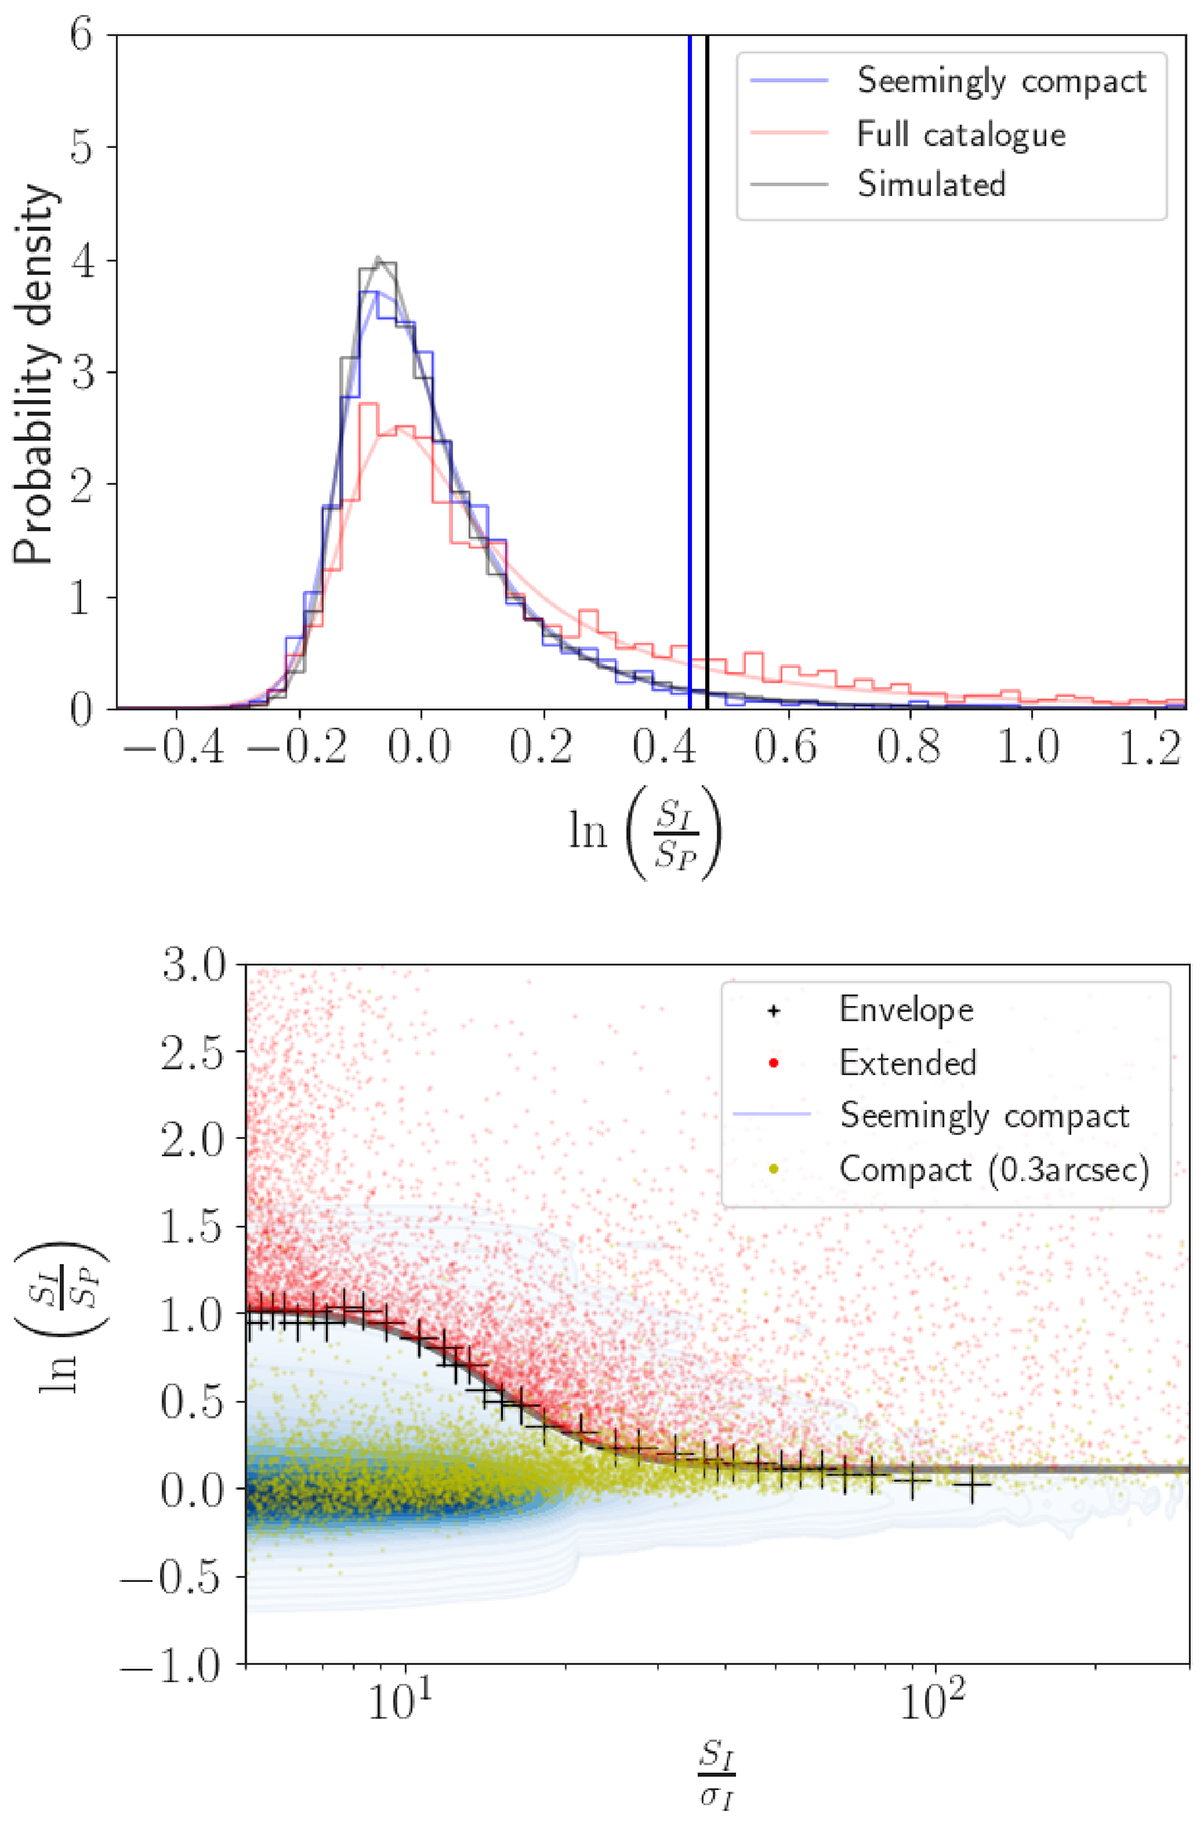
Separation of extended and unresolved sources using the ratio of integrated flux density to peak brightness. Top: Histograms showing the probability density (bin width 0.03) of ![]() for sources with
for sources with ![]() . This corresponds to 999 seemingly compact LoTSS sources (blue), 1673 LoTSS sources in the full catalogue (red) and 35 286 sources in our simulations of seemingly compact sources (grey) described in Sect. 3.1. The fits to the histograms use a normal-inverse Gaussian distribution and are shown with faint solid lines. The vertical lines show the cutoffs we have chosen to separate unresolved from extended sources, these are defined as the location where the complement of the Cumulative Distribution Function for the full catalogue is equal to five times that of the simulated seemingly compact (black) or seemingly compact source (blue) distributions. Hence sources with
. This corresponds to 999 seemingly compact LoTSS sources (blue), 1673 LoTSS sources in the full catalogue (red) and 35 286 sources in our simulations of seemingly compact sources (grey) described in Sect. 3.1. The fits to the histograms use a normal-inverse Gaussian distribution and are shown with faint solid lines. The vertical lines show the cutoffs we have chosen to separate unresolved from extended sources, these are defined as the location where the complement of the Cumulative Distribution Function for the full catalogue is equal to five times that of the simulated seemingly compact (black) or seemingly compact source (blue) distributions. Hence sources with ![]() above this value are five times more likely to lie in the tail of the red curve compared to the black or blue curves. We use this definition as a boundary to separate unresolved from extended sources. Bottom: Separation values for unresolved and extended sources derived from the simulations as a function of
above this value are five times more likely to lie in the tail of the red curve compared to the black or blue curves. We use this definition as a boundary to separate unresolved from extended sources. Bottom: Separation values for unresolved and extended sources derived from the simulations as a function of ![]() are shown with black crosses which have been fit with a sigmoid function (grey). The blue density contours and colour-scale show the seemingly compact LoTSS source population, whereas the red points show the locations of the sources in the full LoTSS catalogue that are extended according to the criteria we have used. The yellow points show the locations of sources in our catalogue that are also detected by de Jong et al. (2024) at 0.3″ resolution.
are shown with black crosses which have been fit with a sigmoid function (grey). The blue density contours and colour-scale show the seemingly compact LoTSS source population, whereas the red points show the locations of the sources in the full LoTSS catalogue that are extended according to the criteria we have used. The yellow points show the locations of sources in our catalogue that are also detected by de Jong et al. (2024) at 0.3″ resolution.
Current usage metrics show cumulative count of Article Views (full-text article views including HTML views, PDF and ePub downloads, according to the available data) and Abstracts Views on Vision4Press platform.
Data correspond to usage on the plateform after 2015. The current usage metrics is available 48-96 hours after online publication and is updated daily on week days.
Initial download of the metrics may take a while.