Fig. 3.
Download original image
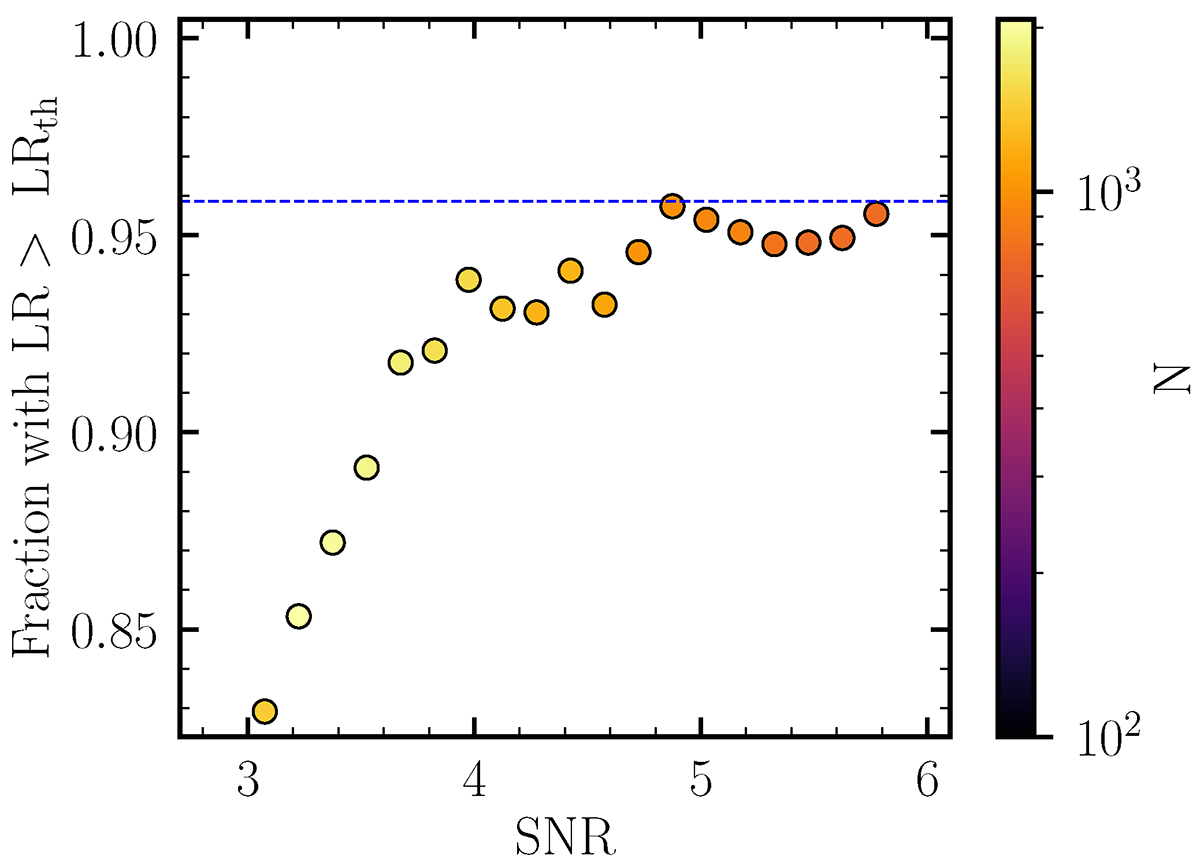
Fraction of small (major axis < 10″) radio sources with a likelihood ratio match as a function of the S/N (SI/σSI). The colour of the points corresponds to the number of sources in each S/N bin. The blue horizontal line corresponds to the overall LR identification rate obtained. We find that lowering the detection threshold to a peak detection significance of 4σthresh results in a large fraction (∼30%) of additional, genuine radio sources compared to adopting a 5σthresh threshold. However, this also leads to a small increase in false detections (by ∼2–3%).
Current usage metrics show cumulative count of Article Views (full-text article views including HTML views, PDF and ePub downloads, according to the available data) and Abstracts Views on Vision4Press platform.
Data correspond to usage on the plateform after 2015. The current usage metrics is available 48-96 hours after online publication and is updated daily on week days.
Initial download of the metrics may take a while.