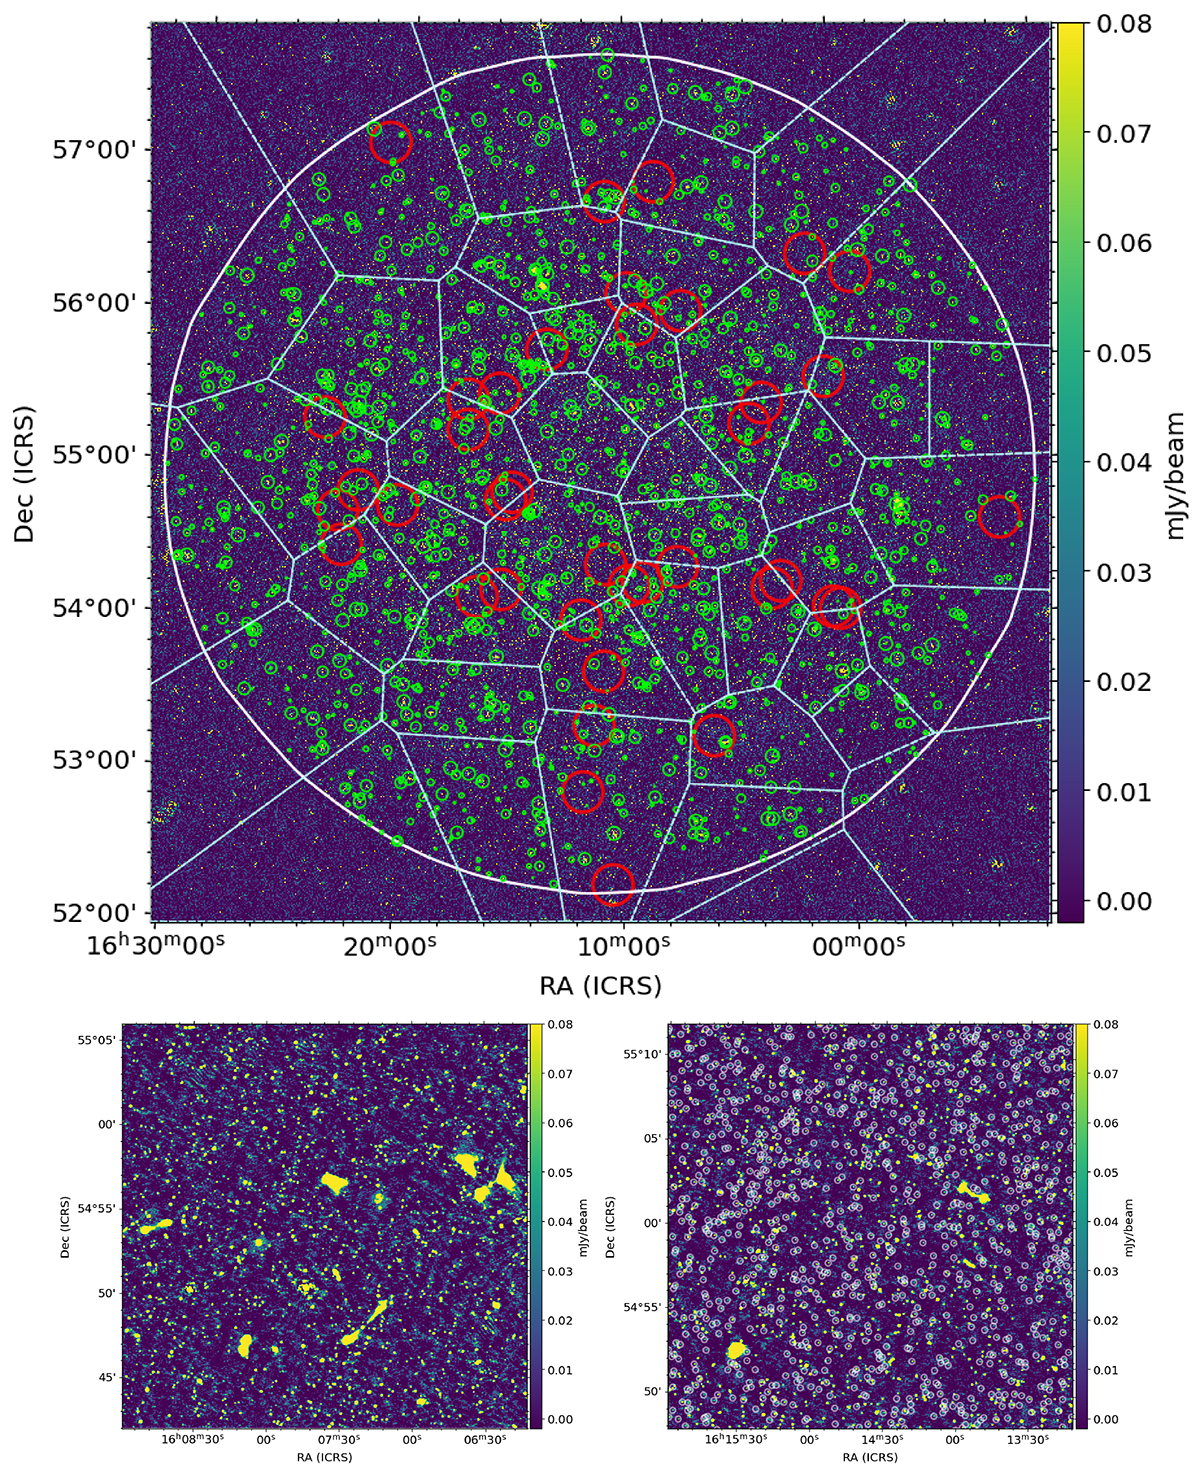
Fig. 2.
Download original image
The final 6″ resolution LoTSS Deep image of ELAIS-N1. The top panel shows the full depth (10.7 μJy beam−1), full area (5.83° ×5.83°) image. The 30% level of the power primary beam is shown in white (approximately a circle of radius 2.8°) and encompasses 24.53 square degrees. The boundaries of the 45 facets used for direction-dependent calibration are shown with light blue lines. The green circles show regions where the noise is limited by the dynamic range (see Sect. 3.4) and the larger red circles show the locations of the most variable sources identified in the field (see Sect. 4.3). The bottom panels show two example 0.4° ×0.4° regions in more detail to highlight the source density (over 10 000 per square degree) and the variation in morphology of detected sources. The grey markers on the bottom right panel show sources in the new ELAIS-N1 catalogue that were not detected by Sabater et al. (2021).
Current usage metrics show cumulative count of Article Views (full-text article views including HTML views, PDF and ePub downloads, according to the available data) and Abstracts Views on Vision4Press platform.
Data correspond to usage on the plateform after 2015. The current usage metrics is available 48-96 hours after online publication and is updated daily on week days.
Initial download of the metrics may take a while.