Fig. 16.
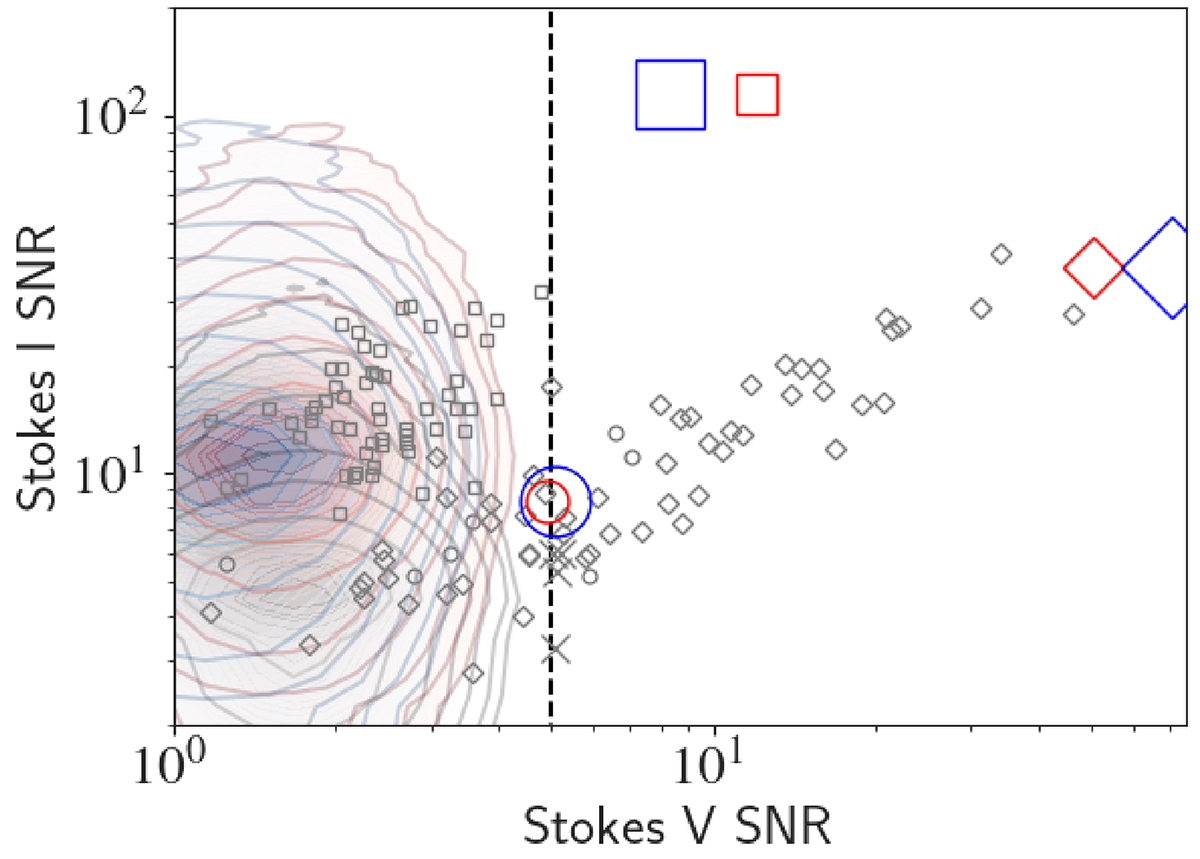
Download original image
Derived fractional circular polarisation for the 37 676 unresolved isolated sources detected in at least one epoch in a region of the map not impacted by dynamic range limitations. CR Draconis and PSR J1552+5437 are also included for demonstration purposes even though they fall outside the selection criteria. The grey (570 944 measurements), red and blue contours show the probability density function for the individual epoch measurements, stacked measurements and stacked absolute value measurements respectively. The lowest contours contain 99% of the measurements. The diamonds, circles, box and x’s show CR Draconis, GJ 625, PSR J1552+5437 and other detections above 5 S/N respectively. The smaller grey symbols represent measurements from the individual epochs, the medium sized red symbols are from the stacked images and the large blue symbols are from the stacked absolute value images. Details of the S/N derivations are given in Sect. 4.4.
Current usage metrics show cumulative count of Article Views (full-text article views including HTML views, PDF and ePub downloads, according to the available data) and Abstracts Views on Vision4Press platform.
Data correspond to usage on the plateform after 2015. The current usage metrics is available 48-96 hours after online publication and is updated daily on week days.
Initial download of the metrics may take a while.