Fig. 14.
Download original image
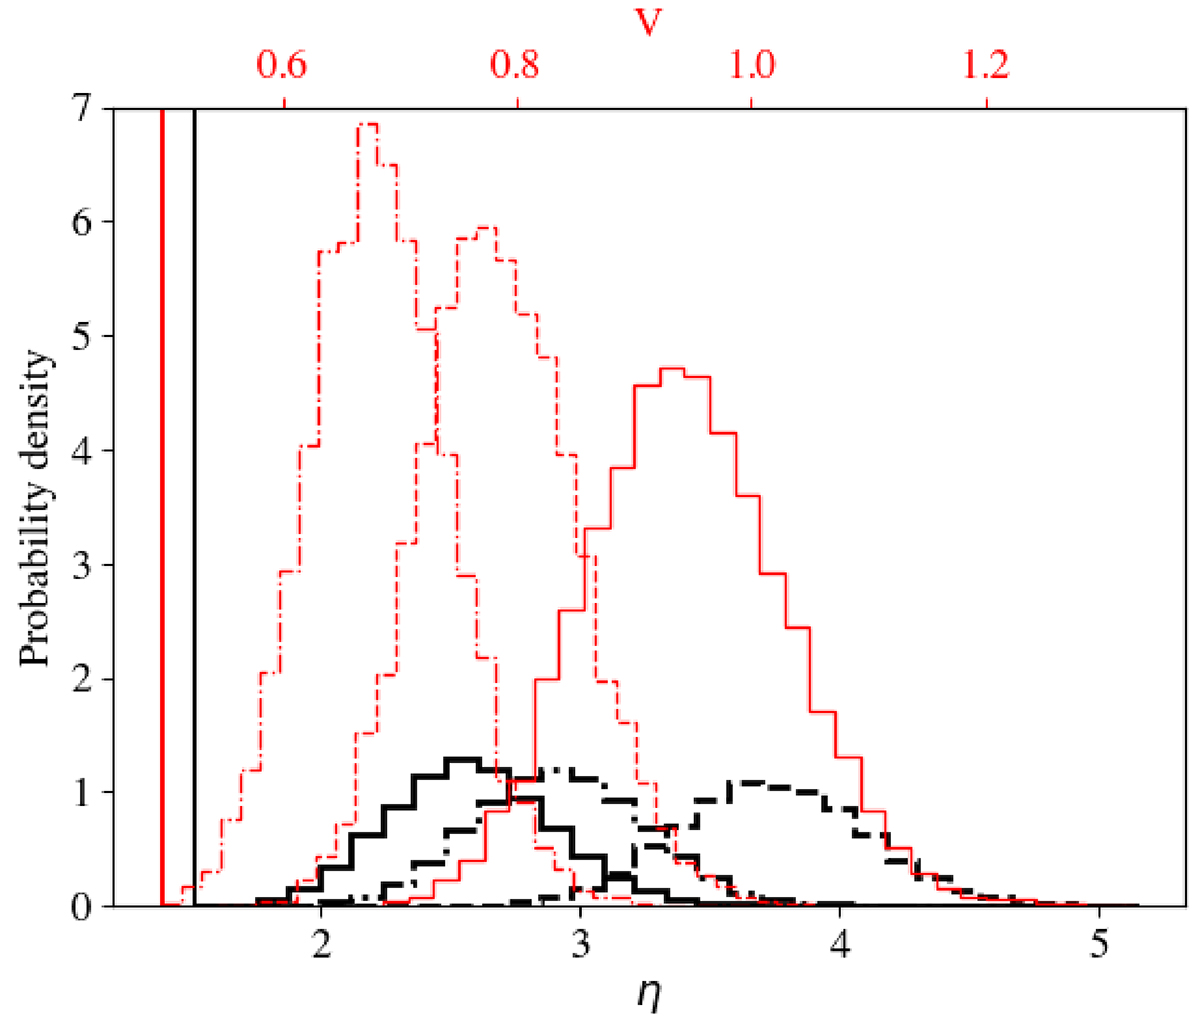
Probability density distributions of the derived variability parameters V and η for GJ 625. In black we show η with the solid, dashed, and dot-dashed lines corresponding to the SI, SP, and SI, ap measurements, respectively. The red shows the V distributions using the same line style. The red and black vertical lines show the lowest derived V and η parameters (i.e. least variation) that we adopt.
Current usage metrics show cumulative count of Article Views (full-text article views including HTML views, PDF and ePub downloads, according to the available data) and Abstracts Views on Vision4Press platform.
Data correspond to usage on the plateform after 2015. The current usage metrics is available 48-96 hours after online publication and is updated daily on week days.
Initial download of the metrics may take a while.